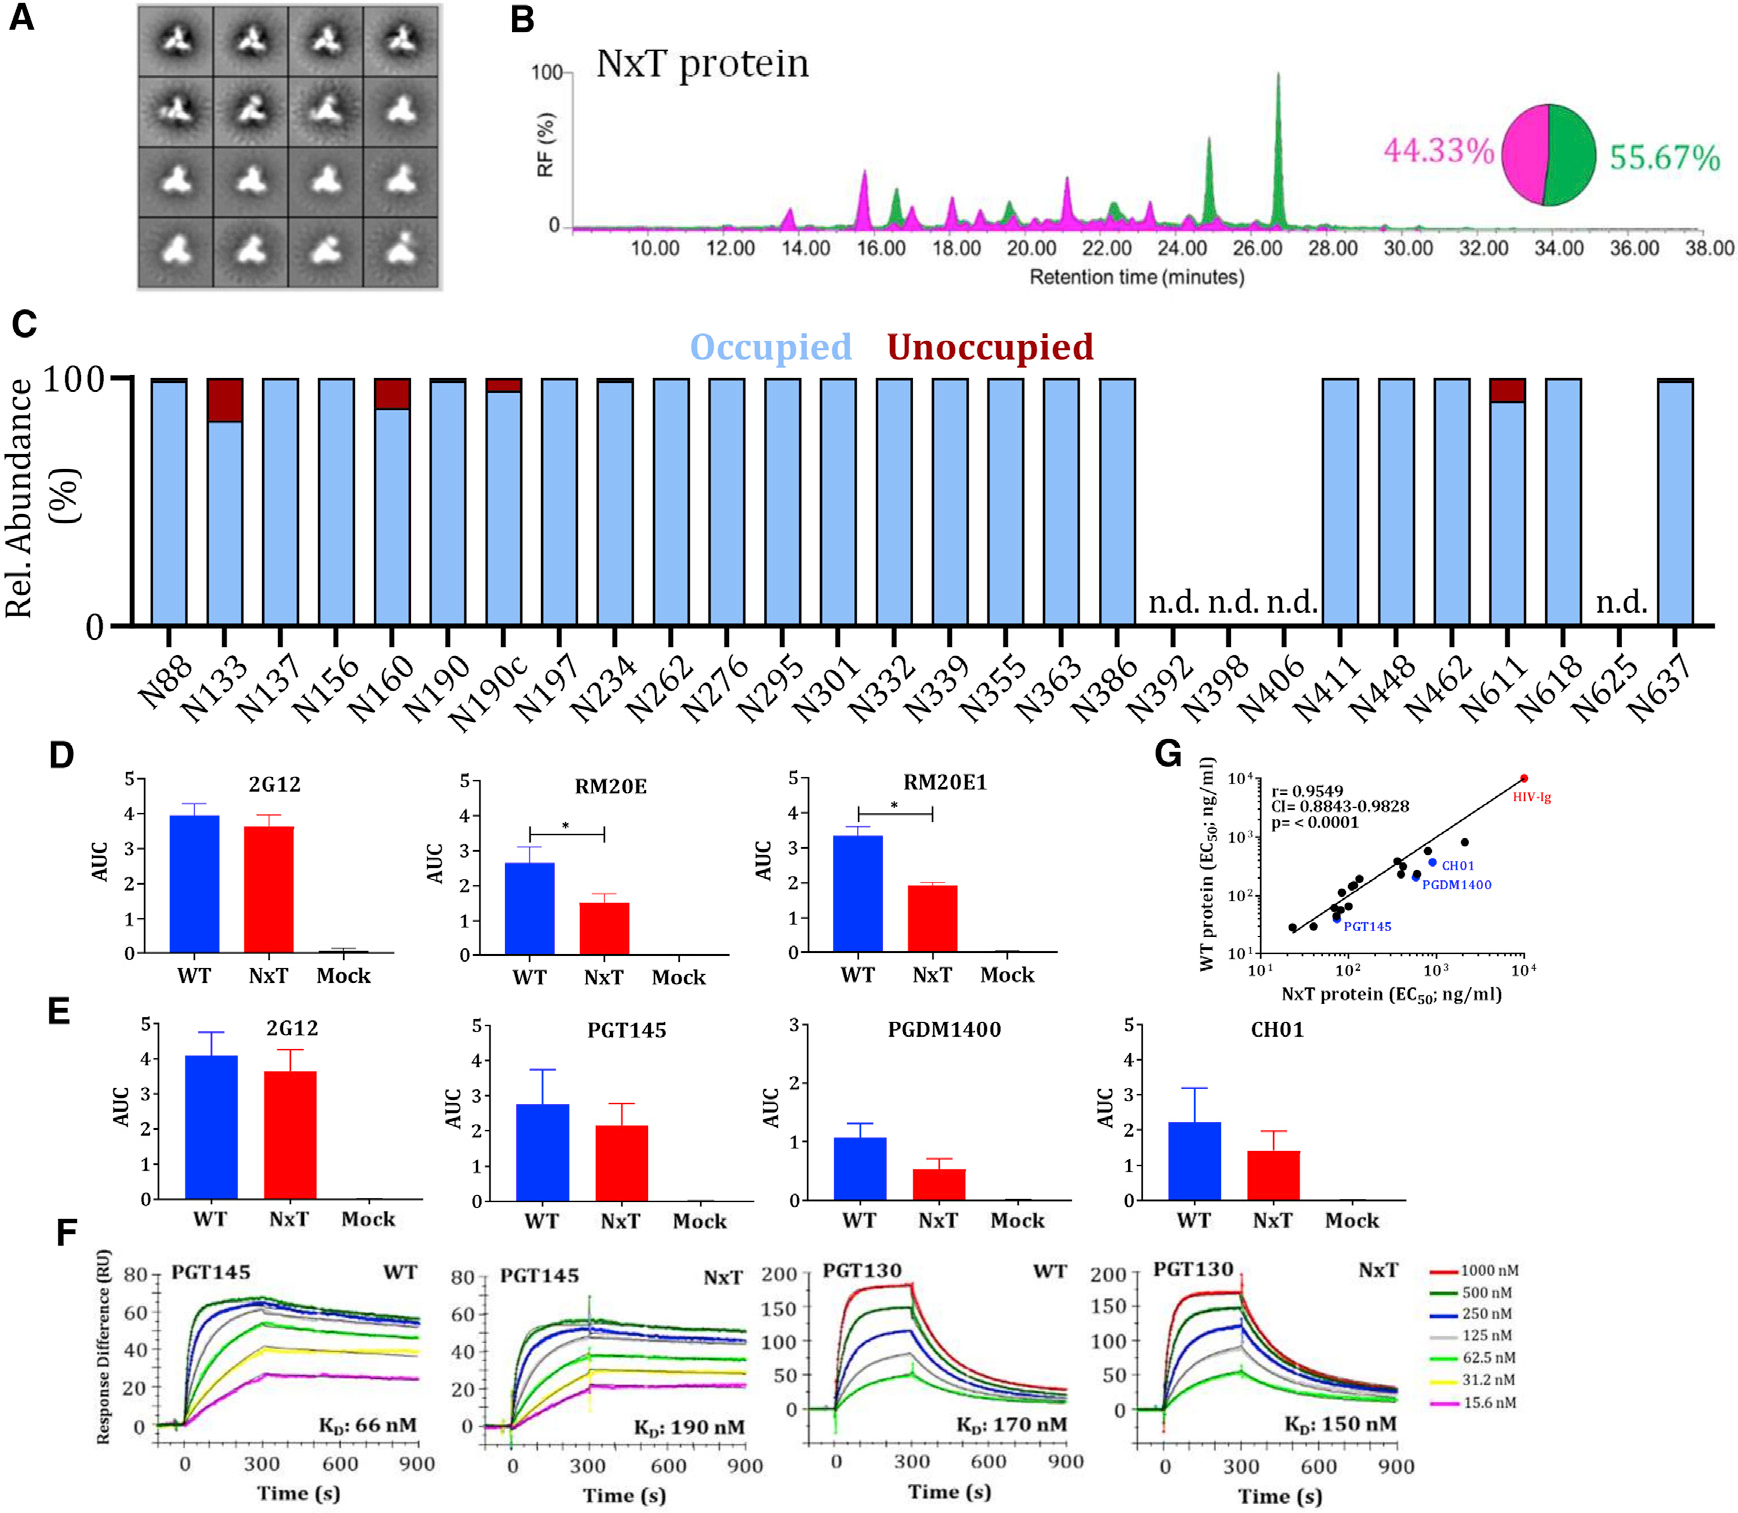
Figure 2. Glycan occupancy is increased by PNGS sequon engineering.

(A) NS-EM analysis of NxT proteins showing the 2D class-averages.
(B) HILIC-UPLC analysis of the NxT protein. The color coding of the spectra and pie chart is the same as in Figure 1E.
(C) Quantification of site-specific occupancy for all 28 PNGS on NxT proteins, derived from LC-ESI MS analyses.
(D) Binding of WT and NxT proteins to two N611-directed non-NAbs, RM20E and RM20E1, isolated from BG505 SOSIP.664 immunized rhesus macaques. The area under the curve (AUC) values derived from ELISA titration curves are plotted. *Indicates a significant difference (p < 0.05) between the WT and NxT proteins, calculated using a Mann-Whitney 2-tailed test.
(E) Binding of WT and NxT proteins to three V2-apex directed bNAbs, PGT145, PGDM1400, and CH01, and also 2G12 for comparison. AUC values derived from derived from ELISA titration curves are plotted.
(F) Binding of bNAbs PGT145 and PGT130 to WT and NxT proteins, assessed by SPR. A summary of the binding kinetics for both bNAbs is in Figure S2E.
(G) The EC50 values derived using WT and NxT proteins were plotted and compared using Spearman’s correlation coefficient. All analyses were performed on NxT proteins produced in HEK293F followed by PGT145 purification. The corresponding data on NxT proteins purified by the 2G12/SEC method are in Figure S2.
