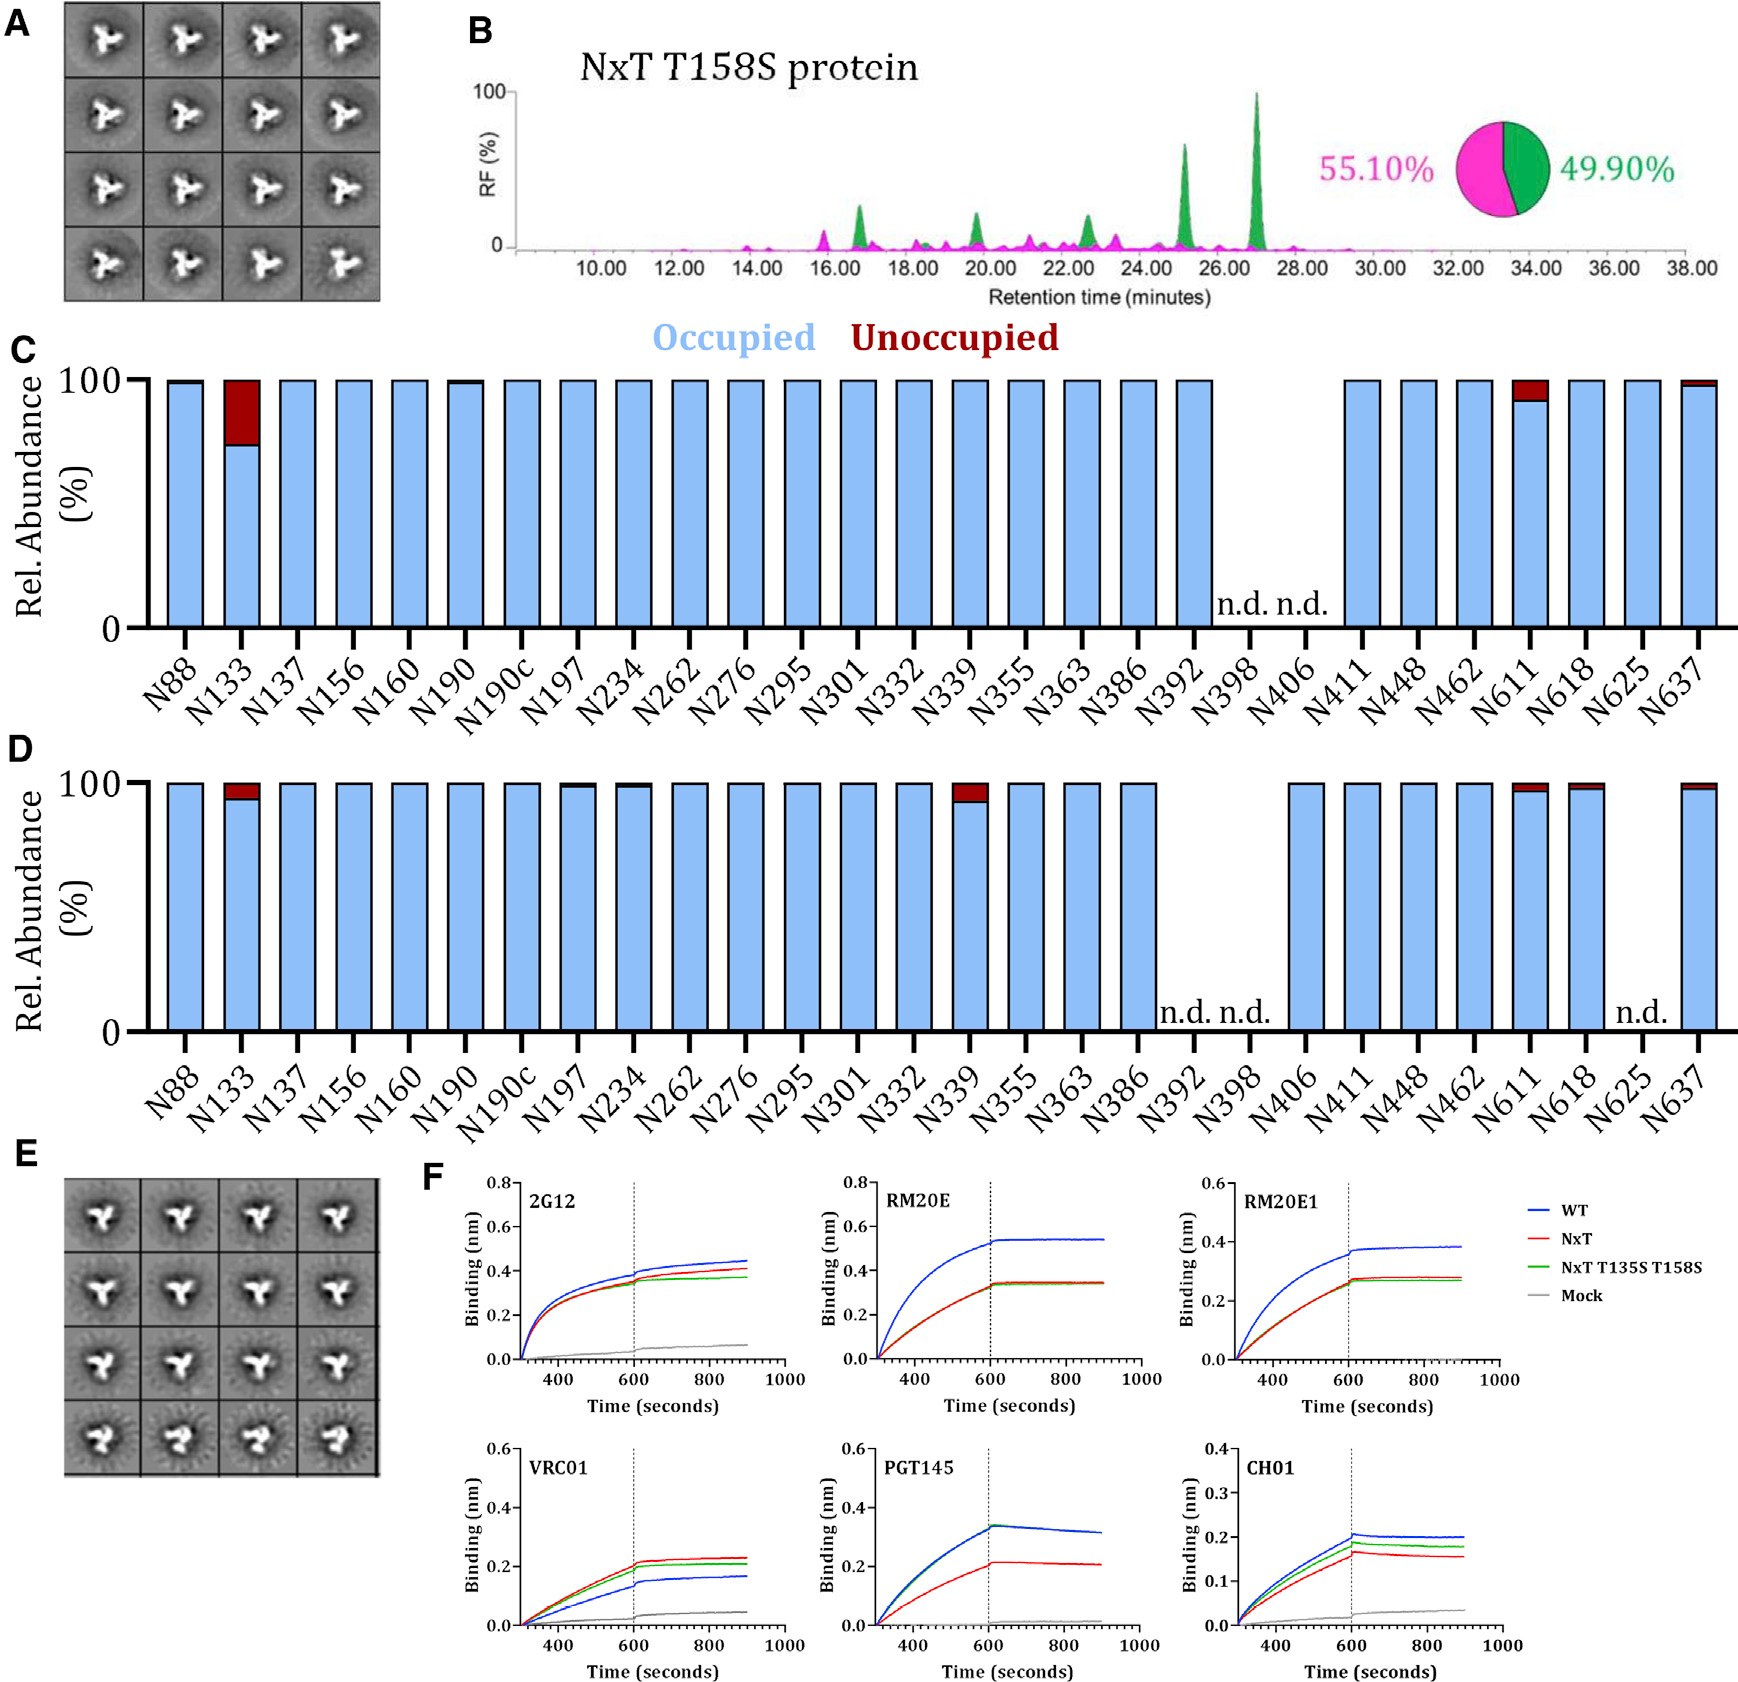
Figure 3. Occupancy of gap-1 sites can be increased by reducing the affinity of the first site for OST.

(A) NS-EM analysis of NxT T158S proteins, showing the 2D class-averages.
(B) HILIC-UPLC analysis of the NxT T158S protein. The color coding of the spectra and pie chart is the same as in Figure 1E.
(C) Quantification of glycan occupancy using LC-ESI MS of the 28 PNGS on NxT T158S proteins.
(D) Quantification of site-specific occupancy for all 28 PNGS on NxT T135S T158S proteins, derived from LC-ESI MS analyses. Results shown are the mean of two independent biological replicates of the NxT T135S T158S protein. The corresponding data on NxT T135S T158S proteins purified by the 2G12/SEC method are in Figure S6.
(E) NS-EM analysis of NxT T135S T158S proteins, showing the 2D class-averages. (F) Binding of non-NAbs RM20E and RM20E1 to WT, NxT, and NxT T135S T158S proteins, assessed by BLI. The bNAb 2G12 was also tested, for comparison. We also tested the binding of bNAbs VRC01, PGT145, and CH01. The average binding curves from 3 independent duplicates are shown. All analyses were performed on NxT T135S T158S trimers produced in HEK293F cells and affinity purified using PGT145.
