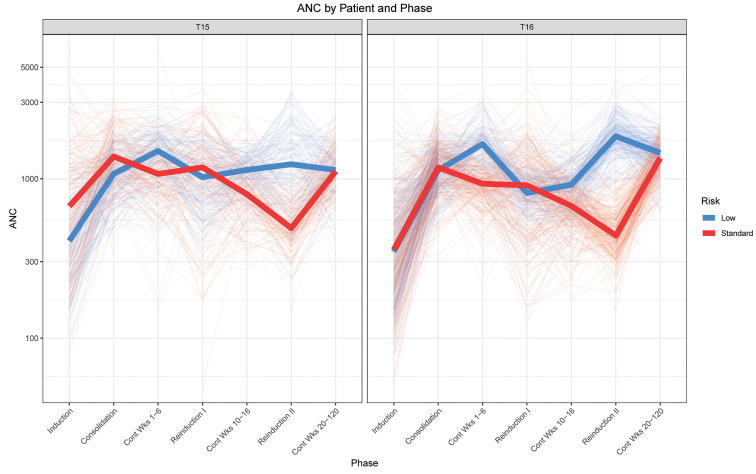
Figure 4.
Absolute neutrophil count by risk group on T15 versus T16. The graphs show the average of fitted absolute neutrophil count (ANC; cells/mm3) data per phase per patient with thick solid lines representing the median per risk group. Based on 46,310 and 64,549 ANC records for T15 and T16, respectively.

