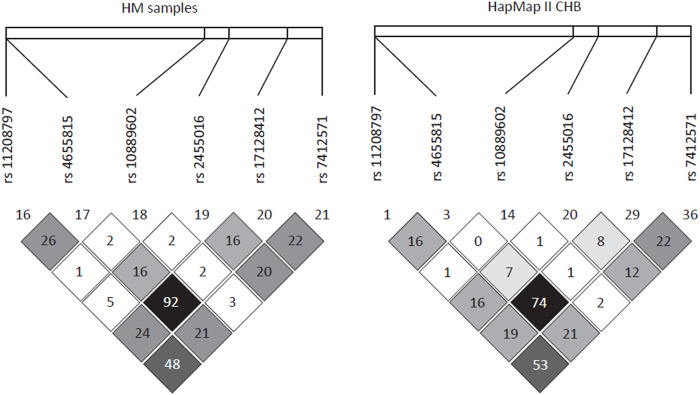
FIGURE 2.
Linkage disequilibrium pattern of the region neighboring rs10889602T/G. In a 30-kb region encompassing rs110889602T/G, there was a very low linkage disequilibrium between this locus and surrounding SNPs in our samples (r 2 < 0.03, left panel) and in Han Chinese in Beijing (CHB) samples of the HapMap project (r 2 < 0.02, right panel).

