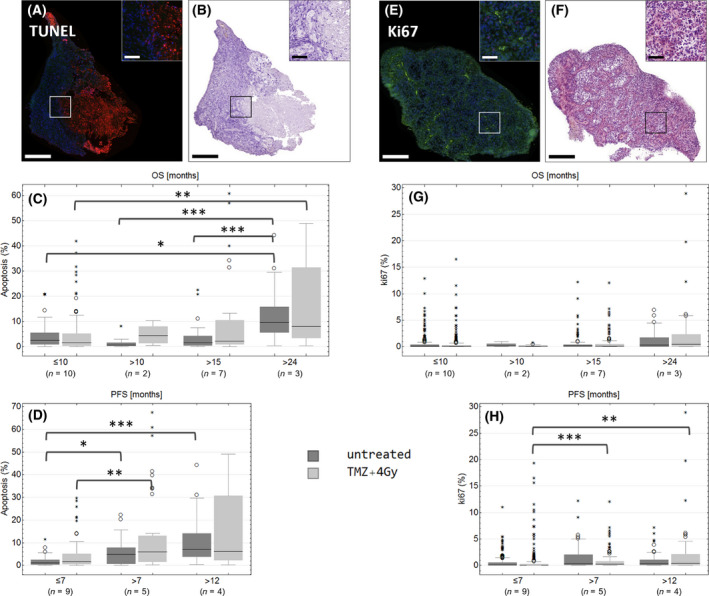
Fig. 1.

TUNEL (A–D) and Ki67 (E–H) staining in treated (light gray) or untreated (dark gray) GBM tissue slices. Treated (light gray, ‘TMZ+4 Gy’) or untreated slices (dark gray, ‘untreated’) were stained with TUNEL assay (red, A–D) or with an antibody against Ki67 (green, E‐H). Fluorescence (A, E) and bright‐field images (B, F) were recorded by a digital slidescanner. Representative images of untreated sectional samples are presented (A‐B, E‐F). For quantification, the total tissue area, DAPI‐positive nuclei area, and the Ki67‐positive or TUNEL‐positive area were determined. Samples were assorted in groups concerning OS (months) and PFS (months). Numbers of biological replicates are as follows: OS ≤ 10: n = 10, OS > 10: n = 2, OS > 15: n = 7, OS > 24: n = 3, PFS ≤ 7: n = 9, PFS > 7: n = 5, PFS > 12: n = 4. Outliers are marked with small circles (O) and extreme values are marked with small asterisks (*). Scale bars: 500, 100 µm in the caption. P‐values were adjusted by Kruskal–Wallis test with Dunn's post hoc test for multiple comparisons. Large asterisks centered above the brackets indicate significant differences: ***P ≤ 0.001, **P ≤ 0.01, *P ≤ 0.05.
