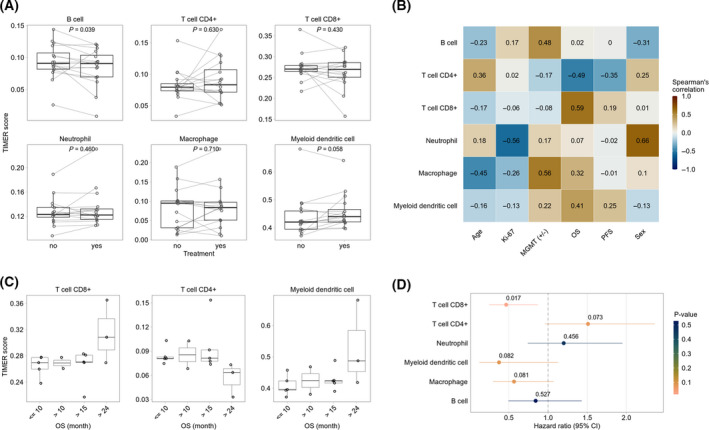
Fig. 2.

Immune microenvironment analyses. (A) Estimated relative abundance of tumor‐infiltrating immune cells using the TIMER deconvolution method in treated and untreated GBM tissue samples. Lines between dots indicate paired samples from the same patient. For patients with more than one replicate, the median relative abundance was calculated. The P‐values indicate the statistical significance from the Wilcoxon test for paired samples. (B) The heatmap presents Spearman’s correlation of clinical parameters and the relative abundance of tumor‐infiltrating immune cells in untreated samples. (C) Examples from correlation analysis (B) between relative abundance of immune cell types and OS. (D) Association of relative abundance of tumor‐infiltrating immune cells with overall patient survival. A univariate Cox regression was performed for untreated samples. The forest plot represents the HR and corresponding 95% confidence intervals (95%CI). The colors and the numbers above the HRs depict the statistical significance (Wald test).
