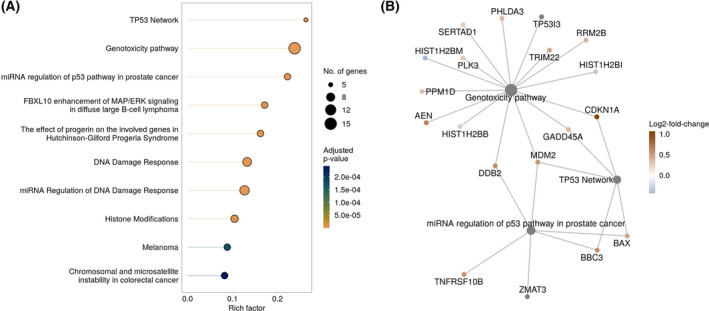
Fig. 4.

Pathway enrichment analysis of DEGs between treated and untreated GBM samples. (A) The top 10 significantly enriched pathways (FDR < 0.05) form the WikiPathways database identified by over‐representation analysis. The x‐axis indicates the rich factor which is the number of DEGs in the pathway divided by the number of background genes in the pathway. The size of the bubble indicates the number of involved DEGs in the pathway. The colors indicate adjusted P‐values of the significantly enriched pathways. (B) The linkages of genes and pathways as a network are shown. Significantly downregulated genes are shown in blue, upregulated genes in red. Shown are the identified DEGs of the three most enriched pathways.
