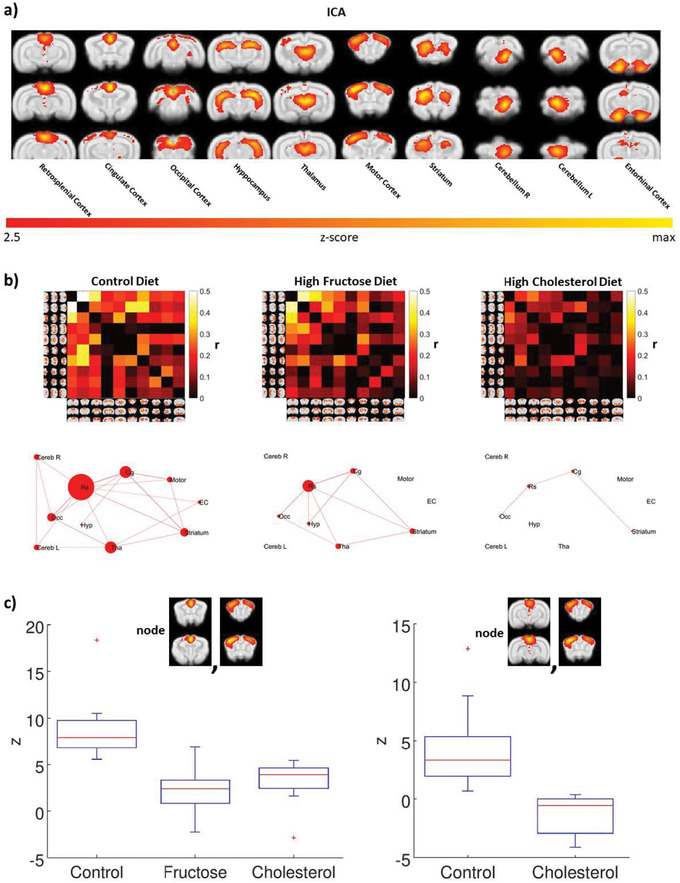
FIGURE 3.

Experimental diets alter intrinsic brain connectivity in awake rabbit, as assayed with functional magnetic resonance imaging. A, Group independent components analysis analysis of all animals identified 10 resting state components: retrosplenial cortex, cingulate cortex, occipital cortex, hippocampus, thalamus, motor cortex, striatum, right cerebellum, left cerebellum, and entorhinal cortex. B, Differences and interactions among the network nodes can be assessed visually with the color intensity matrices and ball‐and‐stick graphs. C, A general linear model analysis of the correlation matrices revealed significant differences in three contrasts: control group > fructose group in the correlation between the cingulate cortex and the motor cortex (P corrected < .05); control group > cholesterol group in the correlation between cingulate cortex and motor, and in the correlation between retrosplenial cortex and motor cortex (P corrected < .05). The fructose group is not represented because there was no significant functional connectivity between retrosplenial cortex and motor cortex for this diet group. Red crosses represent values >1 standard deviation from the mean
