
FIGURE 4.
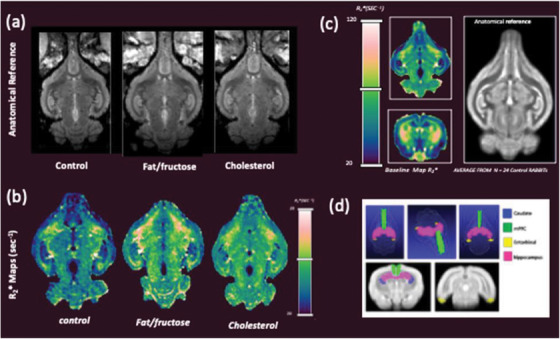
Representative anatomical (A) and R2*images (B) for each group of rabbits. C, Baseline R2* map example (longitudinal and coronal) used for comparative analysis and corresponding anatomical image; image at right shows our digital reference standard compiled from 24 control rabbits. D, 3D rendering and 2D images showing regions of interest used to extract quantitative values for analysis