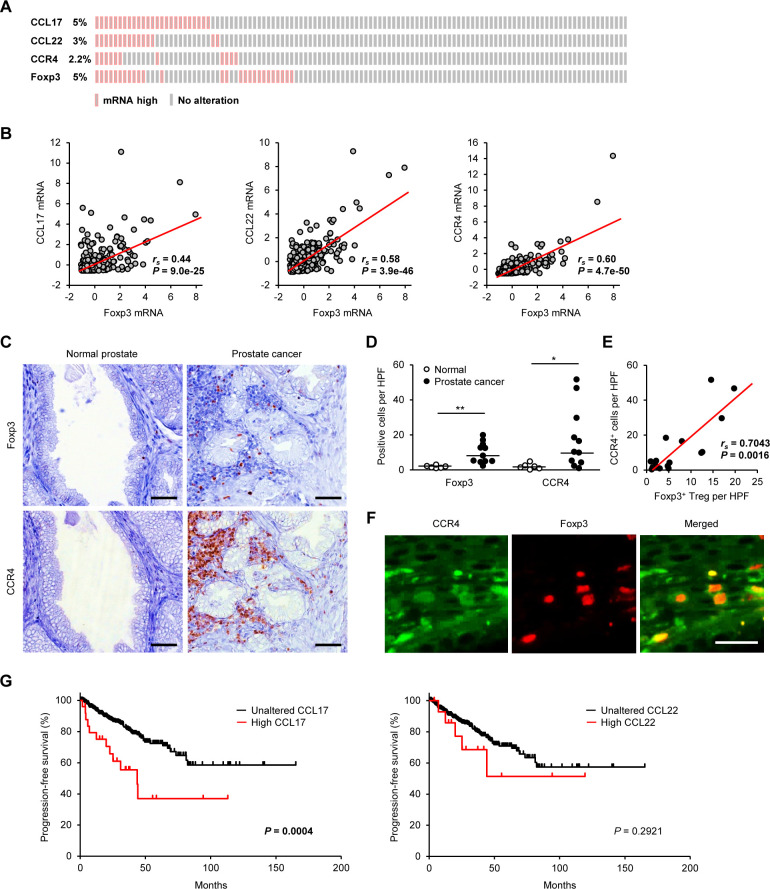
Figure 5.
The CCL17–CCR4 axis is associated with tumor-infiltrating Tregs and prognosis in human patients with prostate cancer. (A) Expression data for CCL17, CCL22, CCR4, and Foxp3 mRNAs in human prostate cancer samples from the TCGA dataset (n=493). (B) Linear regression analysis between Foxp3 expression and CCR4-associated genes (CCL17, CCL22, and CCR4) in human prostate cancer samples from TCGA dataset (n=493); Spearman rank correlation coefficient. (C) Representative images of immunohistochemistry for Foxp3 and CCR4 in human prostate cancer. Scale bar, 50 µm. (D) The number of Foxp3+ Tregs and CCR4+ cells in the prostate of normal volunteers (n=6) and patients with prostate cancer (n=11). Median values are depicted by horizontal lines. (E) Correlation between Foxp3+ Tregs and CCR4+ cells in patients with prostate cancer. Spearman rank correlation coefficient. (F) Representative images of immunofluorescence for CCR4 (green) and Foxp3 (red) in human prostate cancer. Scale bar, 25 µm. (G) Kaplan-Meier curves of PFS according to the mRNA expression of CCL17 (left) and CCL22 (right) in human patients with prostate cancer from TCGA dataset (n=493). Log-rank test. *P<0.05, **P<0.01; non-parametric Mann-Whitney U test. PFS, progression-free survival; Treg, regulatory T cell.

