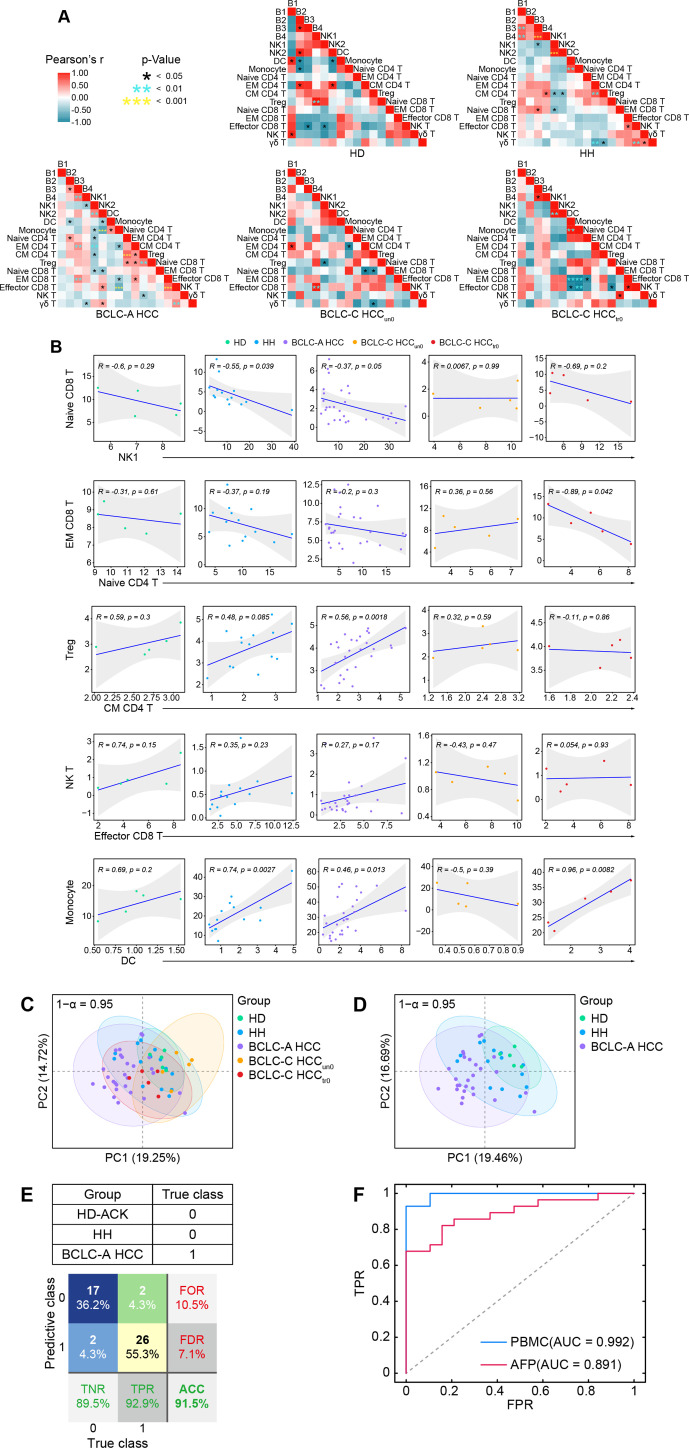
Figure 3.
Altered immune interactions in different stages of HCC and integrated immune features for HCC early detection. (A) Heatmaps of the Pearson correlation coefficients between immune cell subsets across groups. (B) Correlations of the percentages of selected immune cell subsets across groups and the regression line with 95% CI. (C) The PCA projection of total PBMC samples, colored by groups, and each ellipse plot represents the CI of 95% confidence coefficient for individual groups. (D) The PCA projection of HD, Hh, and BCLC-A HCC samples, colored by groups, and each ellipse plot represents the CI of 95% confidence coefficient for individual groups. (E) Confusion matrix of classification result of 47 samples (F) The ROC curves and AUC values of trained AdaBoost-SVM classifier or classified by using AFP levels with a cut-off of 20 ng/mL. ACC, accuracy; AUC, area under the curve; AFP, alpha-fetoprotein; BCLC-A, Barcelona Clinic Liver Cancer Stage A; HCC, hepatocellular carcinoma; HD, healthy donor; HH, hepatic hemangioma; NK, natural killer; PBMC, peripheral blood mononuclear cell; PCA, principal component analysis; FOR, false omission rate; FDR, false discovery rate; FPR, false positive rate; ROC, receiver operating characteristic; TNR, true negative rate; TPR, true positive rate.

