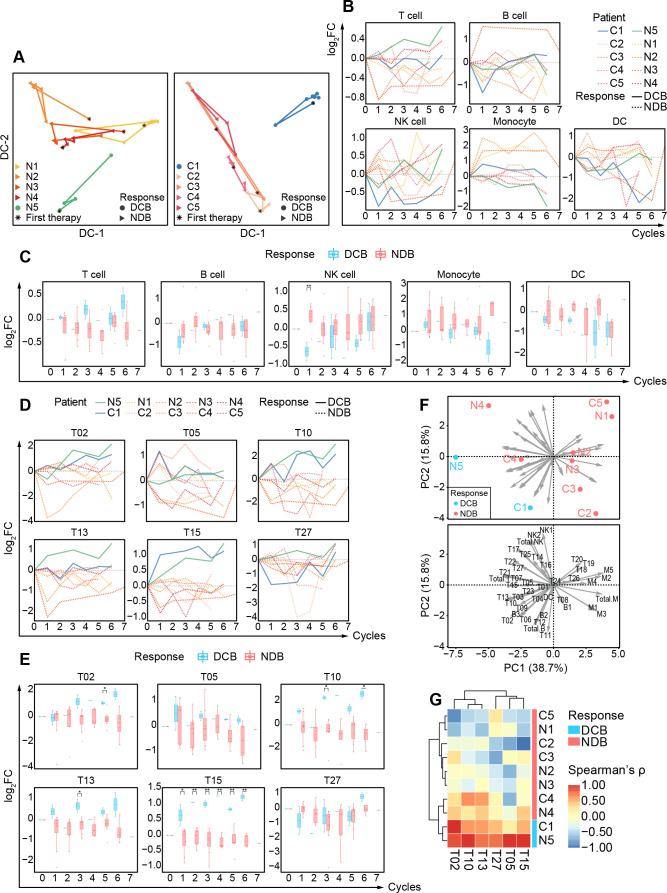
Figure 5.
Detailed longitudinal changes of peripheral immune compositions for patients with DCB and NDB. (A) Diffusion maps based on the frequencies of circulating immune components for 10 patients with BCLC-C HCC treated with immunotherapy, colored by patients, and shaped by clinical responses. (B) The relative changes in the percentages of major immune cell subsets versus baselines of 10 BCLC-C patients during the treatment cycles. The lines are colored by patients and shaped by clinical responses. (C) Comparisons of the log2 (fold change) of the percentages of major immune cell subsets versus baseline between patients with DCB and NDB during the treatment cycles. (D) The relative changes in the percentages of the identified immune cell subsets versus baselines of 10 patients with BCLC-C during the treatment cycles. The lines are colored by patients and shaped by clinical responses. (E) Comparisons of the log2 (fold change) of the percentages of the identified immune cell subsets versus baseline between patients with DCB and NDB during the treatment cycles. (F) The PCA projection of the Spearman correlation coefficients between the relative changes of identified cell clusters and the treatment cycles. Point plots are labeled by patients and colored with DCB and NDB groups (top). The arrow length and direction represent the dominant cell clusters to the directions of PCs (bottom). (G) Heatmap of the Spearman correlation coefficients between the relative changes of identified cell clusters and the treatment cycles, colored by clinical responses on the right. Unpaired Student t-test is used for statistical analysis. (C, E) *p<0.05, **p<0.01. BCLC-C, Barcelona Clinic Liver Cancer Stage C; CDC, dendritic cell; DCB, durable clinical benefit; NDB, non-durable benefit; NK, natural killer; PCA, principal component analysis; PC, principle components.

