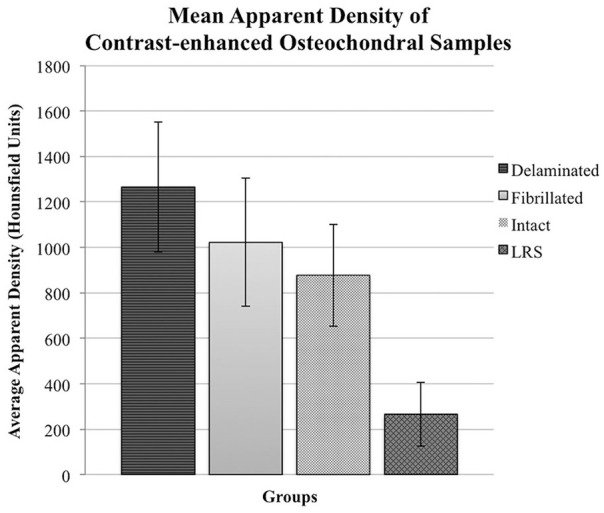
Figure 4.

Mean apparent density (HU) of bovine cartilage after contrast-enhanced µ-computed tomography (CE-µCT). Blocks were imaged in Conray60 (C60) and the superficial layer was either removed (delaminated [n = 11]; fibrillated [n = 11], or left intact [n = 11]). Controls (n = 8) were intact and instead exposed to lactated Ringer’s solution (LRS) prior to μCT.
