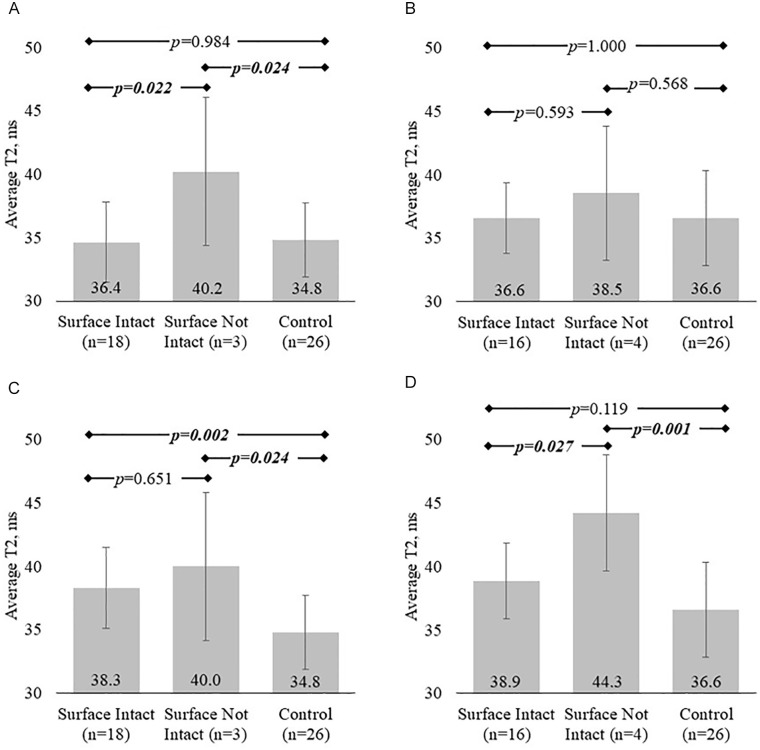
Figure 2.
Average cartilage T2 values grouped by arthroscopic and injury status for each study region. (A) At 6 weeks after ACLR, only participants with surface defects in the MFC have elevated T2 values compared with controls. (C) However, T2 values in surface-intact MFC cartilage increase overtime to become significantly higher than controls at 1 year. Laterally, significant cartilage T2 differences with injury and arthroscopic status do not manifest until 1 year after surgery. (B, D) Lateral femoral cartilage T2 increases between 6 weeks and 1 year following ACLR lead to elevated T2 values in surface-not-intact and a trend for elevation in surface-intact cartilage at 1 year after ACLR. ACLR = anterior cruciate ligament reconstruction; MFC = medial femoral condyle; LFC = lateral femoral condyle. Boldfaced and italicized values indicate a significant difference.

