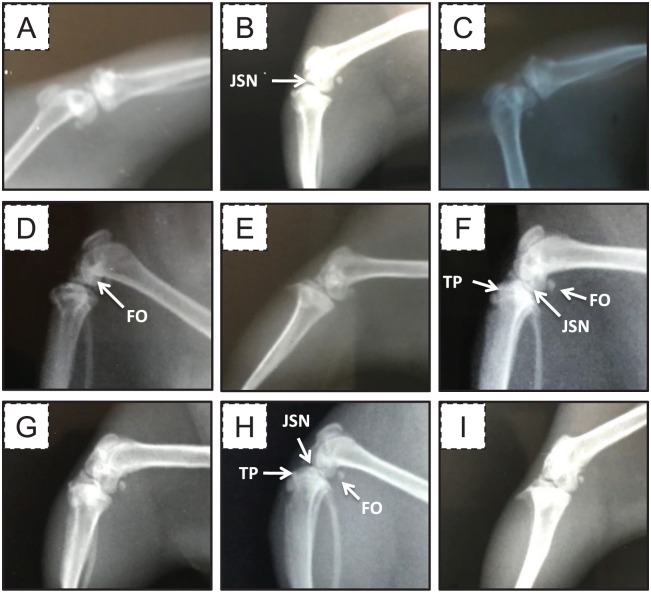
Figure 1.
Representative X-ray films of the right knee joints from different groups. (A) The healthy control group, (B) the OA group at week 2, (C) the sham group at week 2, (D) the OA group at week 4, (E) the sham group at week 4, (F) the OA group at week 6, (G) the sham group at week 6, (H) the OA group at week 8, and (I) the sham group at week 8. FO = femur osteophytes; JSN = joint space narrowing; TP = tibial plateau.

