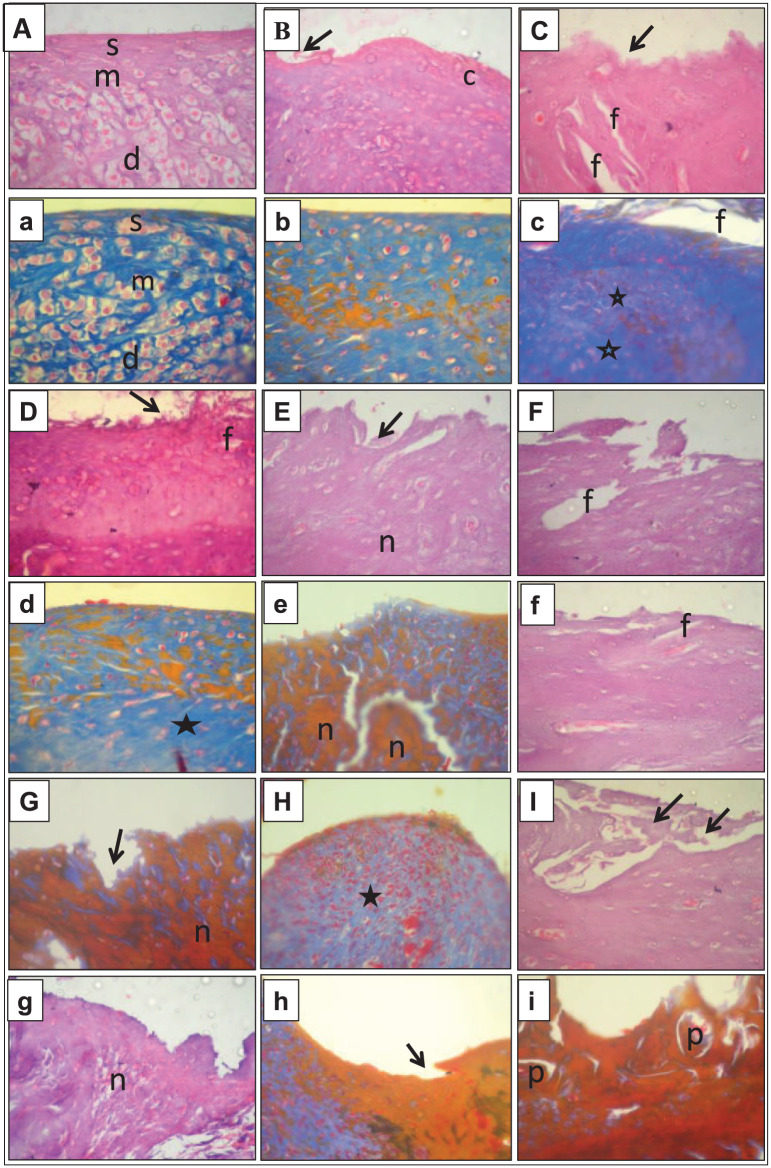
Figure 2.
Photomicrographs of articular cartilage from different groups. The capital letters refer to H&E staining, and the corresponding lowercase letters refer to Mallory’s trichrome staining at a magnification of 10×. (A and a) are examples from the healthy control group, (B and b) sham group week 2, (C and c) OA group week 2, (D and d) sham group week 4, (E and e) OA group week 4, (F and f) sham group week 6, (G and g) OA group week 6, (H and h) sham group week 8, and (I and i) OA group week 8. (c) = chondrocytes; (d) = deep zones; (f) = vertical fissuring; (m) = mid zones; (n) = necrosis; (p) = bone plate; (s) = superficial zones. Stars and arrows are used to point out the changes in the matrix staining and the articular surface, respectively.

