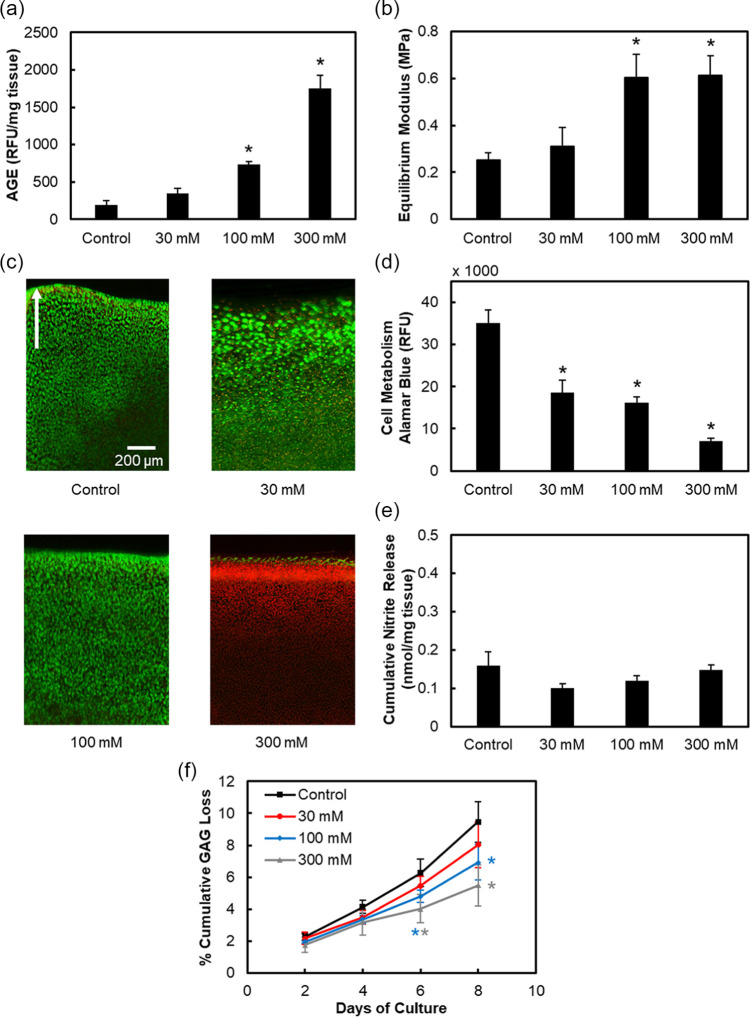
Figure 2.
Ribose dose response. Bovine cartilage explants cultured for 8 days and treated with 30, 100, or 300 mM ribose. Quantification of (a) AGE crosslinks and (b) equilibrium modulus. Chondrocyte viability images in (c) with green and red colors used to show viable and nonviable cells, respectively. Arrow points toward superficial layer of cartilage. Refer to Supplemental Figure S3b for quantification of viability. Cell metabolism in (d), cumulative nitrite release in (e), and cumulative GAG loss in (f). Data are presented as mean ± 95% confidence interval. *Versus control (P < 0.05). Statistical markers are colored with respect to the data.
Lique laborem atem assint.

