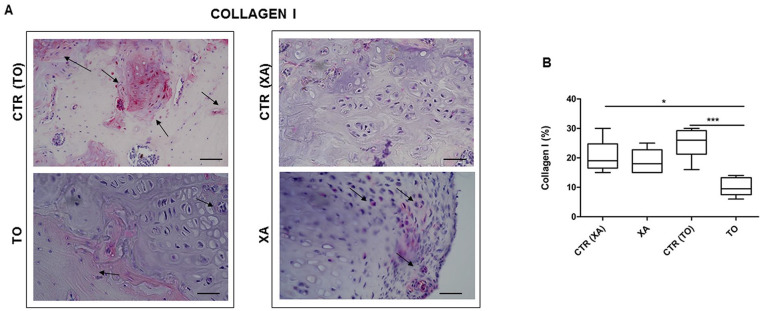
Figure 6.
Immunohistochemical analysis: type 1 collagen. (A) Representative images for the immunohistochemical analysis for type 1 collagen in the TO (knee fragment), XA (xiphoid appendix), CTR (TO), CTR (XA). (B) Graphical representation of protein expression for type 1 collagen after image analysis with hue/saturation/intensity (HSI) system with software NIS-Elements in all groups. Data are expressed as 95% CI of the mean ± SD. **P < 0.01: TO versus CTR (TO) group; *P < 0.05: TO versus CTR (XA) group.

