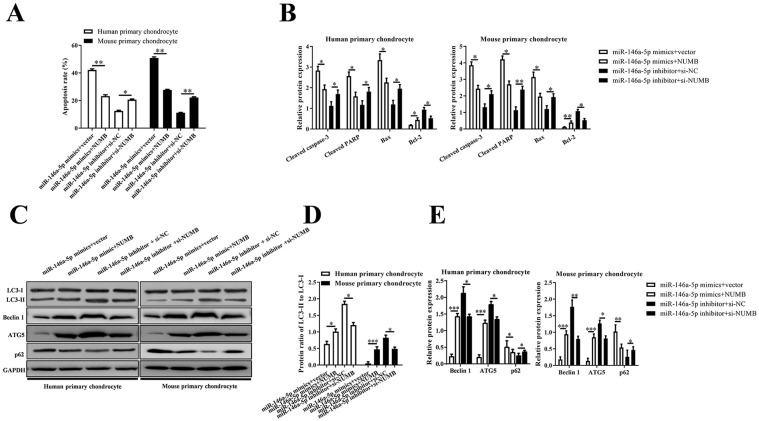
Figure 6.
Human primary chondrocytes and mouse primary chondrocytes were transfected with miR-146a-5p mimic or inhibitor, and/or NUMB or empty vector, si-NUMB or negative control siRNAs, and then stimulated with IL-1β. (A) The histogram showed the cell apoptosis rate of the chondrocytes. (B) The mRNA levels of cleaved caspase 3, cleaved PRAP, Bax, and Bcl2 measured with qRT-PCR. (C) The protein levels of LC3, Beclin1, ATG5, and p62 measured with Western blotting. (D, E) The histogram showed the relative levels of Beclin1, ATG5, and p62 and the ratio of LC3-II to LC3-I.

