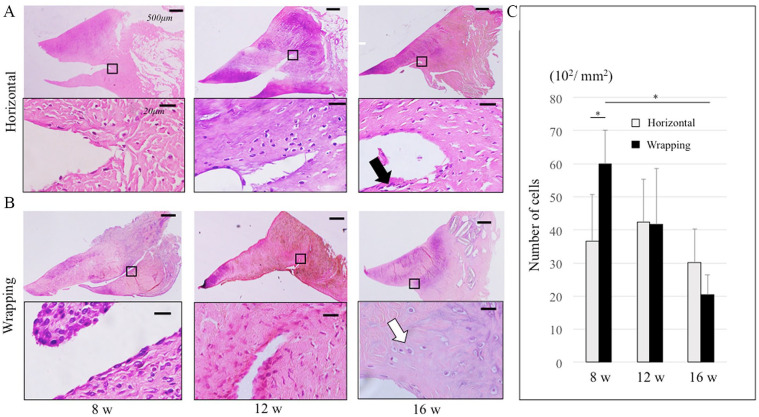
Figure 5.
Cell morphology with hematoxylin and eosin staining of the meniscus. Black square in the upper figure shows the peripheral meniscal tear in the lower figure. (A) Horizontal group at 8, 12, and 16 weeks. Black arrow indicates fibroblast-like cell at 16weeks. (B) Wrapping group at 8, 12, and 16 weeks. White arrow indicates fibrochondrocyte-like cell at 16 weeks. In the upper figures, the bar indicates 500 µm. In the lower figures, the bar indicates 20 µm. (C) This graph indicated the average number of cells at the meniscal tear site at 8, 12, and 16 weeks in both groups. *P < 0.05.

