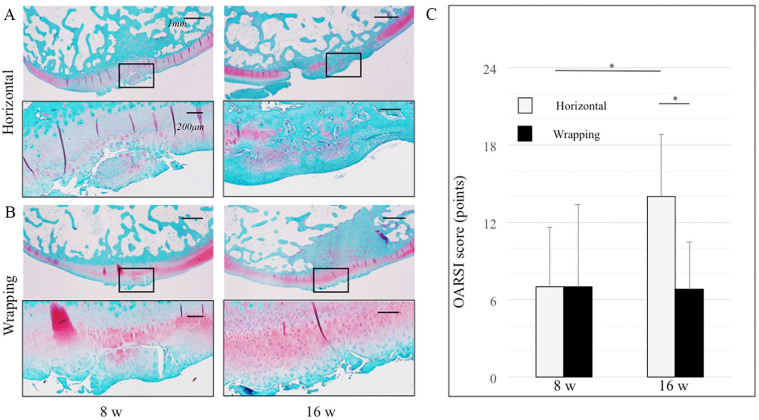
Figure 8.
Articular cartilage stained with Safranin-O/Fast Green stain. Black square in the upper figure shows the cartilage degeneration area in the lower figure. (A) Horizontal group at 8 and 16 weeks. (B) Wrapping group at 8 and 16 weeks. In the upper figures, the bar indicates 1 mm. In the lower figures, the bar indicates 200 µm. (C) OARSI score is shown: range 0-24. A higher score was indicative of increased degenerative changes in the articular cartilage. *P < 0.05.

