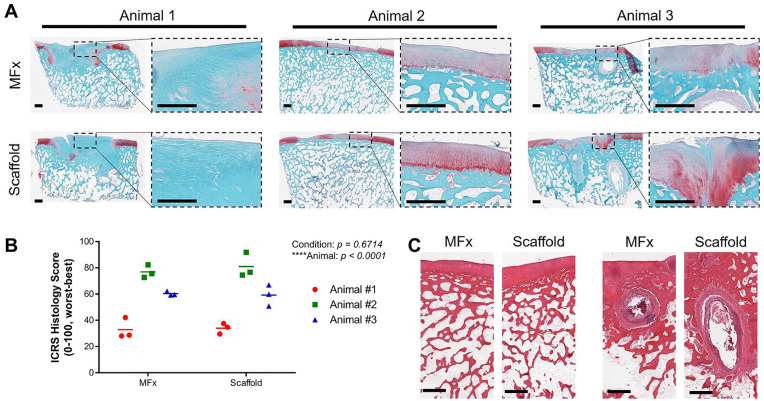
Figure 6.
Long-term histological data. (A) Sections stained for safranin O/fast green for each animal (1, 2, 3) and condition (MFx, Scaffold). Visualization of the whole defect, and a zoom-in of the cartilage are shown. Scale bar = 1 mm. (B) ICRS II histological scoring of the proximal, central, and distal regions of defects, reported for each animal and condition. (C) Hematoxylin and eosin (H&E)-stained sections of defects from Animal 2 (left) and Animal 3 (right), showing similarities between conditions in the same animal. Animal 3 showed subchondral cyst formation in the distal aspect of defects in both MFx- and Scaffold-treated defects.

