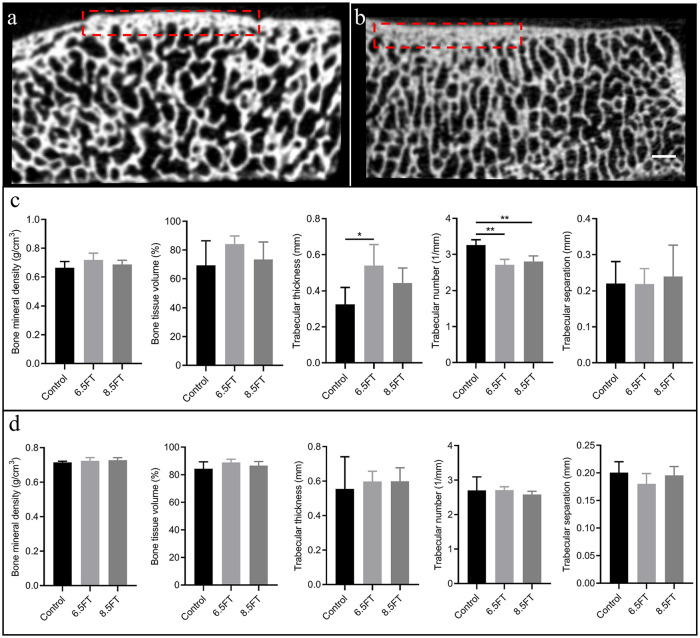
Figure 3.
Schematic of subchondral bone analysis and outcomes of quantitative analysis. (a) Analysis of subchondral bone alterations 1 mm below the full thickness chondral defect. The red dotted rectangular region of interest (ROI) measuring 1 mm in depth below the original chondral defect area represents the analyzed region. (b) Analysis of subchondral bone alterations below kissing lesions on the opposite tibial plateau. The red dotted rectangular region of interest (ROI) measuring 1 mm in depth below the kissing lesion area (the gross view demonstrated that the kissing lesions were mainly distributed in the lateral 1/2 portion of the medial tibial plateau) represents the analyzed region. Scale bar: 1 mm. (c) Quantitative analysis of the aforementioned subchondral bone below the original chondral defect area. (d) Quantitative analysis of the aforementioned subchondral bone below kissing lesions on the opposite tibial plateau. The results are presented as the mean ± standard deviation. *, P < 0.05; **, P < 0.01.

