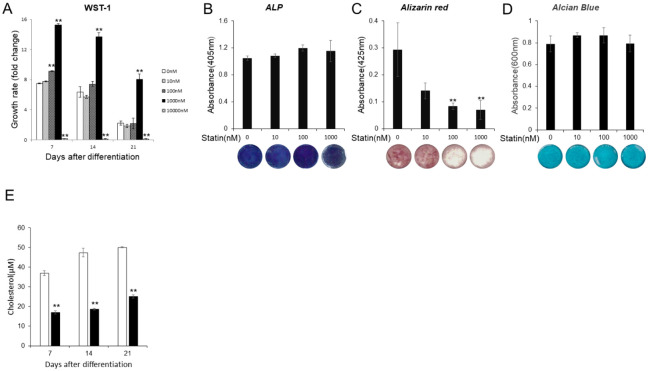
Figure 1.
Various tests with statins at different concentration. (A) Comparison of cell proliferation ability by, WST-1. The growth rates were compared by absorbance before ITS (insulin, transferrin, sodium selenite) treatment as a control at each, concentration on day 0. (B) The comparison of alkaline phosphatase (ALP) activity on day 7 and its image. (C) Comparison of the, dyeability of Alizarin Red on day 21 and its image. (D) Comparison of the dyeability of Alcian Blue on day 21, and its image. (E) To check statin effect for cholesterol . The graph values denote the average ± SD (n = 3), *P < 0.05 and **P < 0.01, estimated by analysis of variance followed by post hoc Tukey-Kramer and compared with, control group at same time point.

