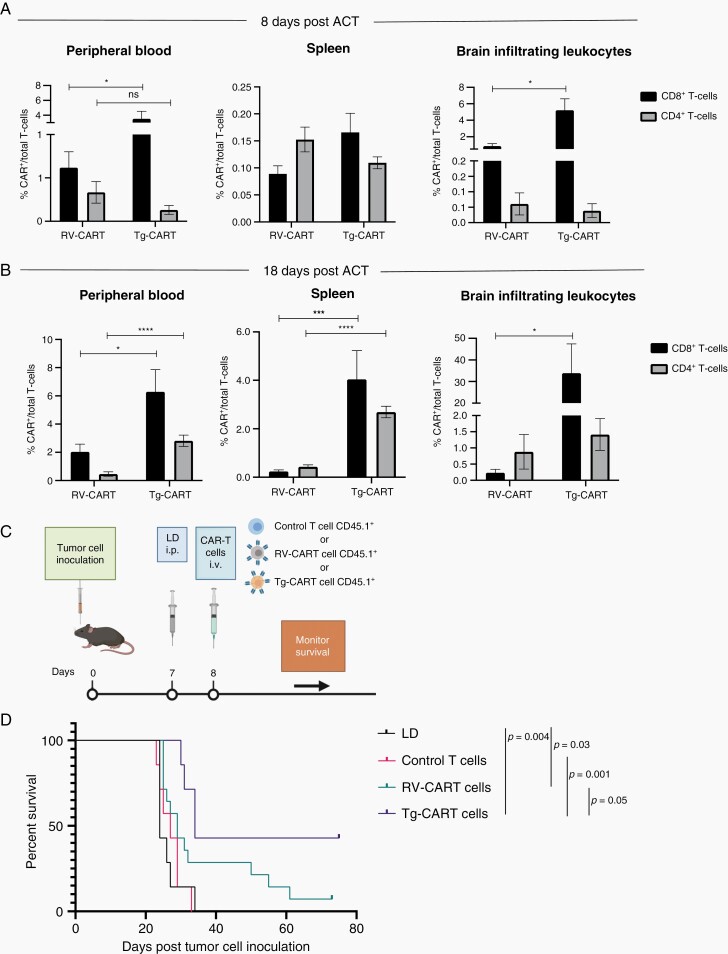
Fig. 4.
Tg-CART cells persist better following IV infusion in tumor-bearing animals and prolong mouse survival further than RV-CART cells. Tumor-bearing mice were treated as in Figure 1B. Tissues were analyzed by FC for the presence of CART cells 8 days (A) and 18 days (B) after infusion. CART cell abundance is shown as the percentage of all CD3+ lymphocytes. Bars represent the mean of 6 biological replicates for (A) and 3-6 pooled biological replicates for (B). (C) Schematic of the treatment protocol. (D) Kaplan-Meier curves: LD group (MS = 24 days, n = 7), control T cells (MS = 27 days, n = 7), RV-CART cells (MS = 29 days, n = 14), and Tg-CART cells (MS = 34 days, n = 7). Abbreviations: CART, chimeric antigen receptor-transduced T cells; FC, flow cytometry; IV, intravenous; LD, lymphodepletion; MS, median survival.

