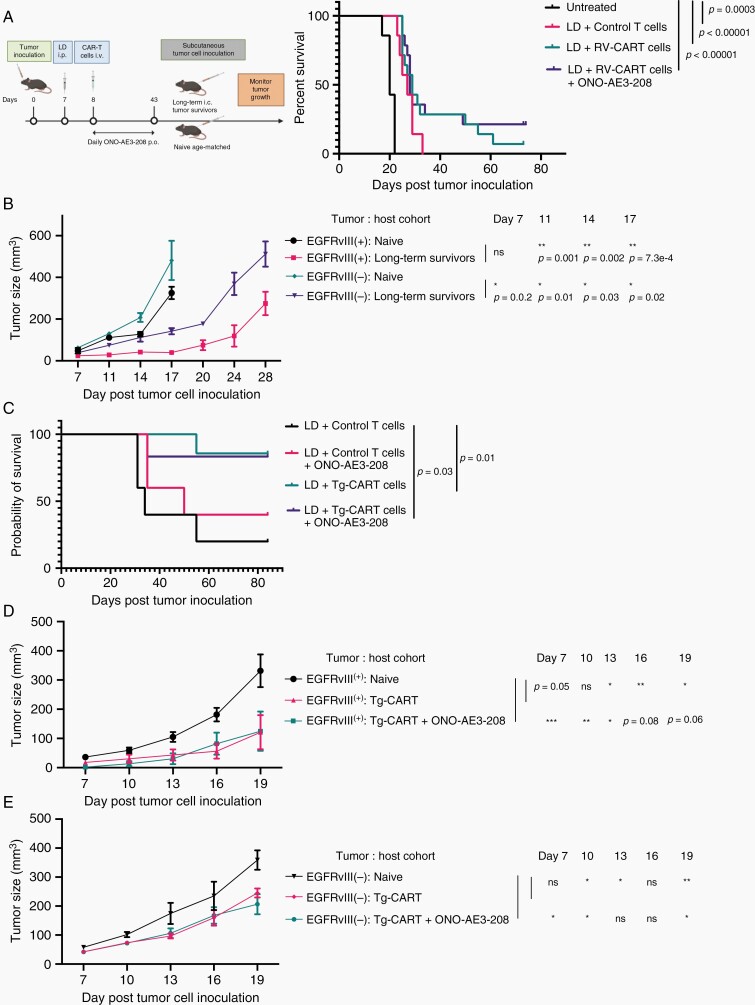
Fig. 6.
The use of Tg-CART cells allows for the evaluation of long-term anti-tumor memory response. (A) Treatment protocol for the combination regimen of CART therapy and ONO-AE3-208. Mice receiving control T cells, RV-CART (in A) or Tg-CART (in C) therapy were randomized to receive daily p.o. treatment of either vehicle or 10 mg/kg ONO-AE3-208 for up to 35 consecutive days. Kaplan-Meier curves in (A) Untreated (MS = 20 days, n = 7), LD + Control T cells (MS = 27 days, n = 7), LD + RV-CART cells (MS = 29 days, n = 14), and LD + RV-CART cells + ONO-AE3-208 (MS = 28 days, n = 14); Kaplan-Meier curves in C: LD + Control T cells (MS = 34 days, n = 5), LD + Control T cells + ONO-AE3-208 (MS = 50 days, n = 5), LD + Tg-CART cells (MS not reached, n = 7), LD + Tg-CART + ONO-AE3-208 (MS not reached, n = 7). (B) Long-term survivors from the LD + CART + ONO-AE3 group received s.c. injections of 4 × 10⁵ parental SB28 cells (EGFRvIII−, left flank) and 4 × 10⁵ SB28-EGFRvIII cells (EGFRvIII+, right flank). Tumor size (mm3) was recorded every 3 days. Treatment-naïve, age-matched C57BL6/J mice received identical s.c. injections as controls. (D, E) Long-term survivors treated with Tg-CART cells in (C) were re-challenged with s.c. tumors as described in (B). Sizes of EGFRvIII+ (D) or parental EGFRvIII− tumors (E) in mice treated with LD + Tg-CART cells (pink lines; n = 6), LD + Tg-CART + ONO-AE3-208 (green lines; n = 5), or control treatment-naïve mice (black lines; n = 5) were recorded every 3 days. Mean tumor size values of naïve vs previously treated mice were analyzed by Student t test. Abbreviations: CART, chimeric antigen receptor-transduced T cells; LD, lymphodepletion; MS, median survival; s.c., subcutaneous.

