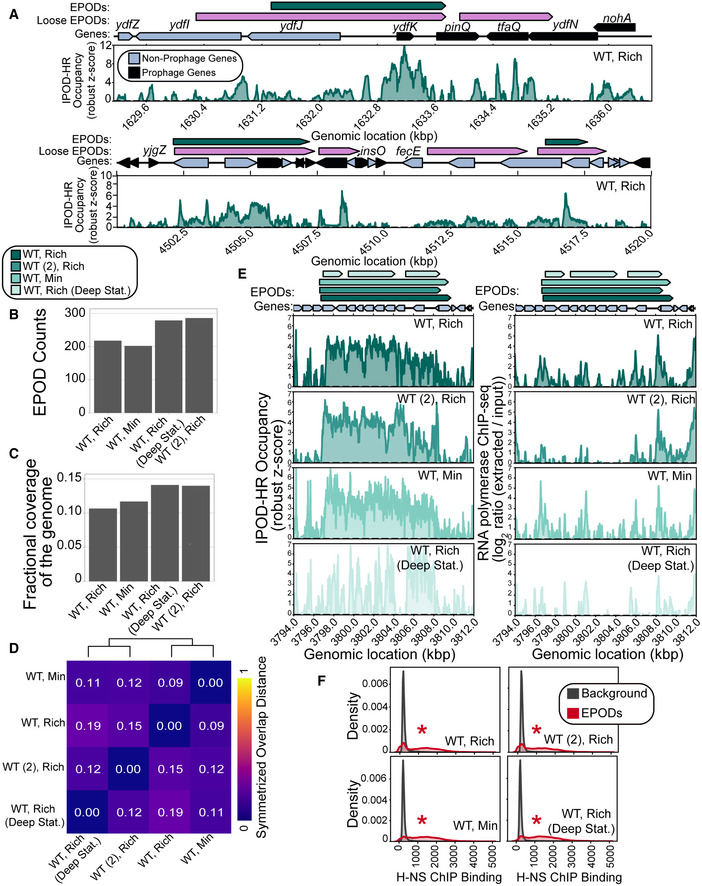
Figure 1. EPODs are highly robust across growth conditions.

- Example regions exhibiting the IPOD‐HR occupancy where EPOD calls are made. Loose EPODs (pink) and Strict EPODs (teal) represent spans of high protein occupancy at lower and higher thresholds, respectively. Neighboring areas showing lower robust z scores are not EPODs. Note that following the definitions in (preprint: Freddolino et al, 2021b), the presence of an EPOD requires a sustained region of high average occupancy, without any regions in which occupancy drops to background levels. Thus, breaks in EPOD calls represent cases where a rolling average occupancy drops below the calling threshold (e.g., the breakpoint in the middle of pinQ in the top panel), and regions of apparent occupancy may nevertheless not be called due to being below the minimum length threshold (as is the case for nohA).
- Strict EPOD counts across WT (MG1655) E. coli cells are similar across different conditions. Cells were grown in: Rich (Rich Defined Media (see Materials and Methods)), Min (Minimal Media) and collected at log phase growth or deep stationary phase (Deep Stat.). WT (2) is a MG1655 isolate from another laboratory that differs from our WT strain by four‐point mutations and two insertion sequence integrations.
- Fractional coverage of Strict EPODs across the genome does not largely vary across conditions; however, cells grown in the Min condition have a slightly larger coverage.
- To assess the similarity between EPOD calls in each condition, we calculated the symmetrized overlap distance of EPODs. A value of 0 indicates that the set of EPODs are identical. Hierarchical clustering reveals that growth phase impacts EPOD location in this dataset.
- Specific locations across all conditions remain occupied by protein where EPODs across a representative region, the waa operon, were called (left) and unoccupied by RNA polymerase (right). The quantile‐normalized robust z scores of the protein occupancy at each 5 bp are represented by the IPOD‐HR occupancy.
- Kernel density plots displaying the normalized histograms (smoothed by a kernel density estimator) of H‐NS ChIP (Kahramanoglou et al, 2011) for regions of the genome within EPODs versus Background (i.e., protein occupancy through the rest of the genome, where contiguous regions between EPODs were treated as a single data point). H‐NS binding shows a strong overlap with EPOD locations measured in all conditions. (*) indicates FDR‐corrected P < 0.005 via permutation test indicating an enrichment in H‐NS ChIP binding in EPODs across conditions (against a null hypothesis of no difference in medians).
