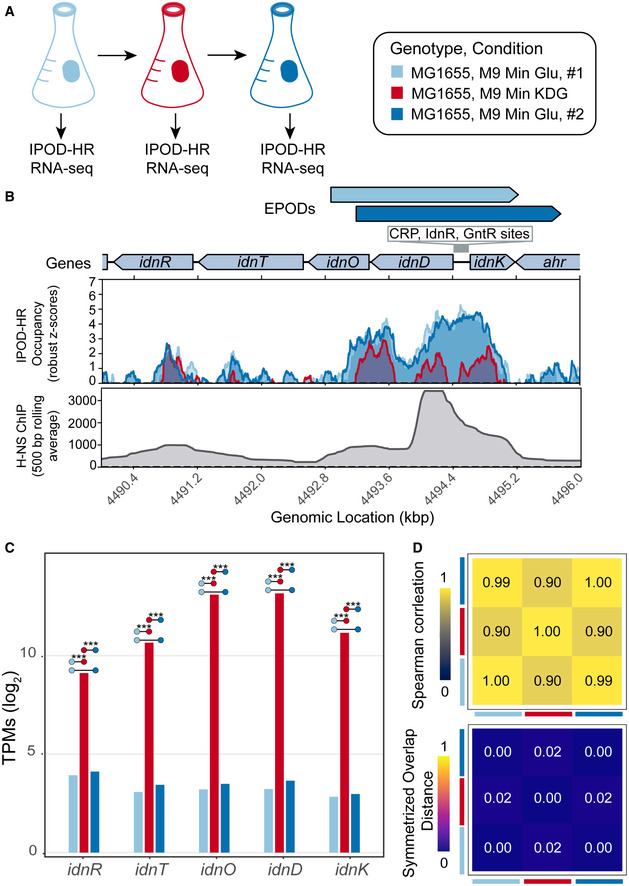
Figure 3. Changes in EPODs are induced in specific conditions.

- Experimental overview. WT, MG1655 cells were grown in M9 minimal media with 0.2% glucose, samples were collected at mid log phase of growth (OD600 ~0.2) for RNA‐seq and IPOD‐HR. The cells were back diluted to an OD600 of ~0.1 in M9 minimal media with 0.2% 5‐Keto‐D‐gluconic‐acid (KDG), grown to an OD600 of ~0.2, collected for RNA‐seq and IPOD‐HR. In the final shift, the cells were back diluted to an OD600 of ~0.003 in M9 minimal media with 0.2% glucose, grown to OD600 of 0.2 and collected for RNA‐seq and IPOD‐HR. Two biological replicates were performed.
- Protein occupancy over the idn operon for each condition (colors are denoted in (A)). The quantile‐normalized robust z scores of the protein occupancy at each 5 bp are represented by the IPOD‐HR occupancy. There is a large loss in protein occupancy when cells are shifted to KDG, leading to the loss of the called EPOD. Protein occupancy is restored once cells are grown in the second glucose condition. The 500bp normalized average of previously published H‐NS ChIP‐seq (Kahramanoglou et al, 2011) exhibits high H‐NS binding on the idnD promoter region.
- To examine the expression of the idn operon at each shift, RNA‐seq was performed. RNA‐seq expression estimates log2‐scaled for idn operon genes for WT cells grown in each condition (as colored in (A)). Comparisons are denoted with colored dots with significance stars representing the adjusted P‐value where (***) signify q‐values < 0.0005 (called using DeSeq2, as described in Methods).
- Spearman correlations are represented with the heatmap comparing the whole‐transcriptome expression profiles in each condition, where identical expression values for every gene show a Spearman correlation of 1. The symmetrized overlap distance was calculated for all EPODs for each condition, where a value of 0 is identical. The colored squares on the sides of the heatmaps denote the condition (following the colors shown in (A)).
