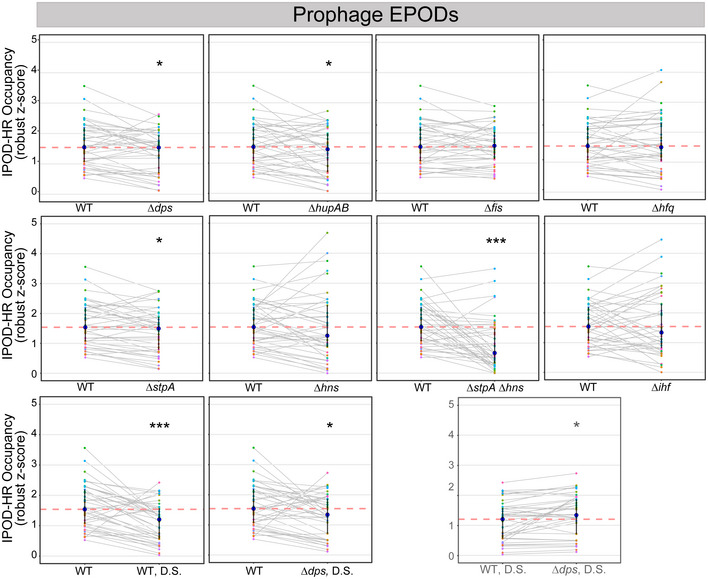
Figure EV3. Global protein occupancy across prophage EPODs changes with deletion of NAPs.

The average IPOD‐HR occupancy (robust z scores) across each of the 41 prophage EPODs of WT and NAP deletions. Each colored dot represents an individual EPOD. Gray lines connect the same EPOD in WT (or WT D.S.) versus NAP deletion to appreciate the change in occupancy for that particular EPOD. The pink dashed line indicates the median of the WT comparison. The dark blue dot indicates the median of the genotype and transparent lines display the interquartile ranges. The summary of these data is displayed as violins in Fig 5B. As shown in Fig 5B, (*) indicate the Wilcoxon rank‐sum P value comparing the change in pseudomedian versus WT for each condition that has been adjusted using the Benjamini and Hochberg method (against a null hypothesis of no difference in pseudomedians). The gray line denotes the same comparison between the D.S. conditions. P value < 0.05 = *, < 0.0005 = ***.
