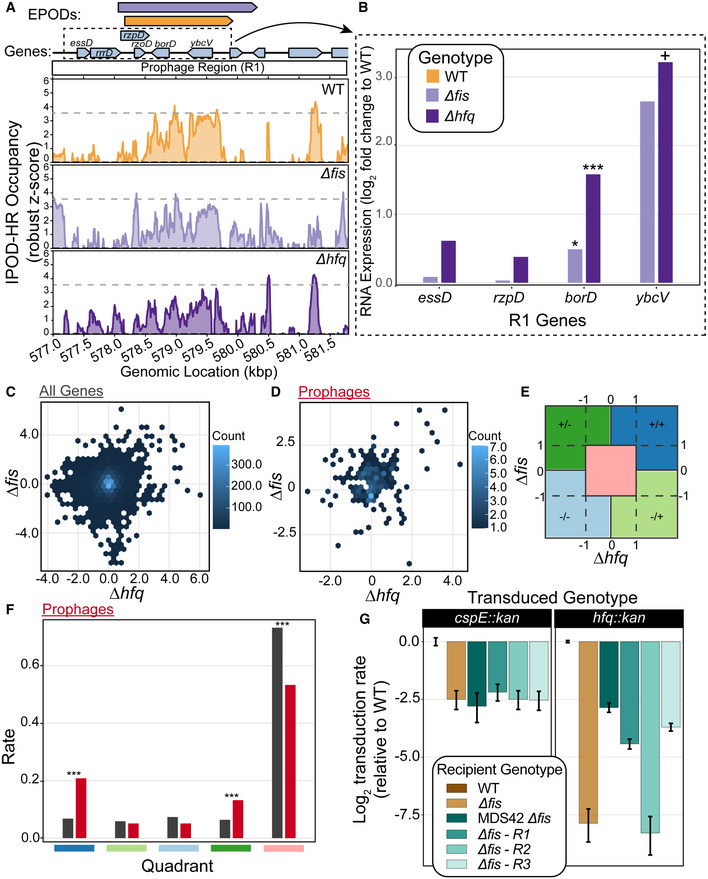
Figure 6. Loss of Fis and Hfq is lethal in a prophage‐dependent manner.

- Example prophage region that is annotated with the Fis‐ and Hfq‐associated HMM class 5 in our genome‐wide HMM classification (Table 1). The quantile‐normalized robust z scores of the protein occupancy at each 5 bp are represented by the IPOD‐HR occupancy. Prophage genes are highlighted with a red box. The major peak associated with WT IPOD‐HR occupancy is represented in a gray dashed line as a reference to compare IPOD‐HR occupancy in the other genotypes. Modest loss of protein occupancy was observed at the same prophage‐containing EPOD for ∆fis (light purple; see color key in (B)) and ∆hfq (dark purple; see color key in (B)) conditions compared to WT (gold).
- RNA‐seq of WT, ∆fis, and ∆hfq were performed. The log fold change compared to WT was calculated at prophage genes contained in the dashed box in (A). Induction of prophages across the region where loss in occupancy is observed. (*) indicate the adjusted P‐value: < 0.10 = +, < 0.05 = *, < 0.005 = **, < 0.0005 = *** (calculated using DeSeq2 as described in Methods).
- The log fold change of all genes for ∆fis and ∆hfq are shown in a hexbin plot. Counts for each gene transcript contained in one bin are denoted with the counts bar.
- The log fold change of all prophage genes for ∆fis and ∆hfq are shown in a hexbin plot.
- Outline of quadrant map to calculate the number of genes that fall within each quadrant for (F). The symbols represent log fold changes compared to WT in ∆fis / ∆hfq. For instance, +/+ denotes a positive log fold change in ∆fis and ∆hfq, −/+ denotes negative log fold change in ∆fis and positive in ∆hfq.
- Rate ratios of all genes (black) and prophage genes (red) in each quadrant outline in (E), showing a higher rate of genes that resided in the +/+ category, indicating that many prophages are de‐repressed in both ∆fis and ∆hfq. (*) indicate the P‐value calculated from testing the null that the rate ratios are the same. P‐value < 0.05 = *, < 0.005 = **, < 0.0005 = *** (calculated using DeSeq2 as described in Methods).
- P1 vir transduction experiment to test the viability of ∆fis and ∆hfq. Strain identities are indicated in the box. Number of transductions was counted on LB + Kan plates; all efficiencies are relative to WT, and thus the log‐scaled relative transduction rate for the WT itself is 0 by definition. ‐R1 indicates that the prophage region in (A) was deleted to test whether the loss of prophages silenced by Fis and Hfq restored viability of a ∆fis∆hfq genotype. R2 and R3 were other regions in the genome that contained prophages that appeared to have Fis/Hfq‐dependent EPODs. Plotted values are mean efficiencies across replicates, with error bars showing a 95% credible interval obtained via Bayesian inference, assuming the replicate‐level colony counts are Poisson distributed with a (conjugate) Gamma(0,0) prior; all log ratios (including error bounds) are plotted relative to the mean WT value. Data obtained from 5 biological replicates for hfq::kan transductions and 4 biological replicates for cspE::kan transductions.
