
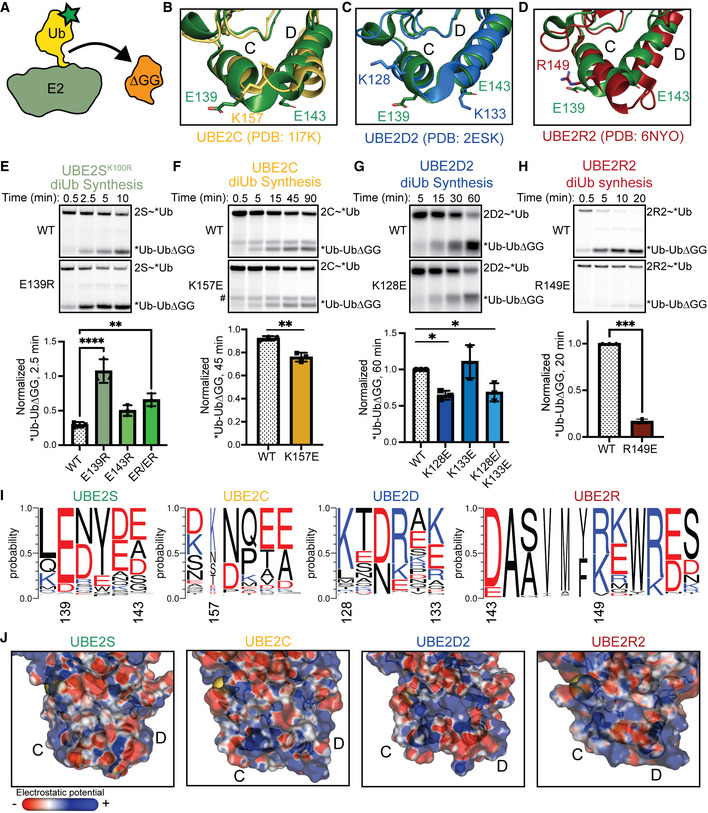
Figure 2. The charge at the E2HTH modulates the intrinsic activity of the E2.
-
ACartoon of pulse‐chase diUb synthesis assays, related to (E–H), where the donor Ub is fluorescently labeled and transferred to unlabeled acceptor UbΔGG.
- B
- C
- D
-
E–HPulse‐chase diUb synthesis assays using different E2s, UBE2S (E), UBE2C (F), UBE2D2 (G), or UBE2R2 (H). DiUb formation was monitored by fluorescent scanning (top), quantitated (bottom), and assessed for statistical significance by either an unpaired Welch’s t‐test (UBE2C and UBE2R2) or one‐way ANOVA (UBE2S and UBE2D2) (*P ≤ 0.05, **P ≤ 0.01, ***P ≤ 0.001, ****P ≤ 0.0001, n = 3 independent, technical replicates for all E2s). Error bars: SEM. Data normalized to the maximal WT diUb formation. # denotes a contaminant band.
-
IWeblogos of the HTH motifs of UBE2S, UBE2C, UBE2D, and UBE2R. Residues colored according to their average net negative (red) or positive (blue) charge. Residues of interest on UBE2S, UBE2C, UBE2D, and UBE2R are labeled. UBE2R is extended to show conservation of D143, used in Fig 4.
-
JNegative charges at the E2HTH weaken the diUb synthesis activity of the E2 family. Electrostatic models of the UBE2S, UBE2C, UBE2D2, and UBE2R2 HTH motifs were generated using the PBEQ solver (Jo et al, 2008). Active site cysteine is indicated as a yellow sphere. Negative to positive charge represented as a red to blue gradient.
Source data are available online for this figure.