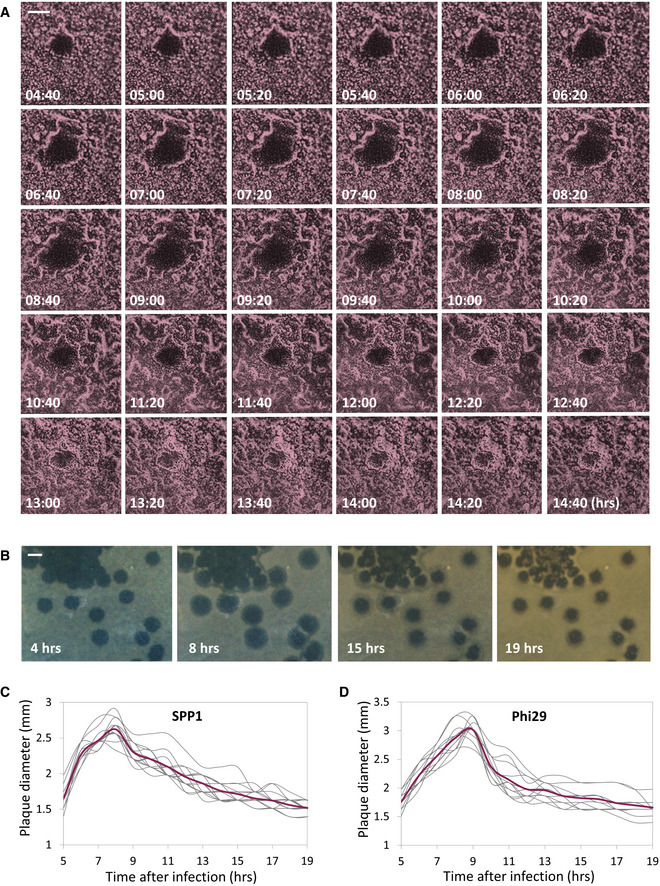
Figure 1. Plaque formation dynamics reveals phases of expansion and constriction.

-
ABDR2637 (P veg‐mCherry) cells were infected with low concentrations (10‐8 PFU/ml) of SPP1, placed on an agarose pad, and plaque formation was followed by time‐lapse confocal microscopy. Shown are overlay images from mCherry signal (purple) and phase contrast (gray) of the bacterial lawn captured at the indicated time points (h). The plaque is seen as a hole formed on the bacterial lawn. Scale bar, 150 µm. Corresponds to Movie EV1.
- B
-
C, DThe dynamic of SPP1 (C) and Phi29 (D) plaque formation following PY79 (WT) infection was monitored as described in (B). Shown is the diameter of individual plaques for each phage (n ≥ 12), with the average highlighted in red.
