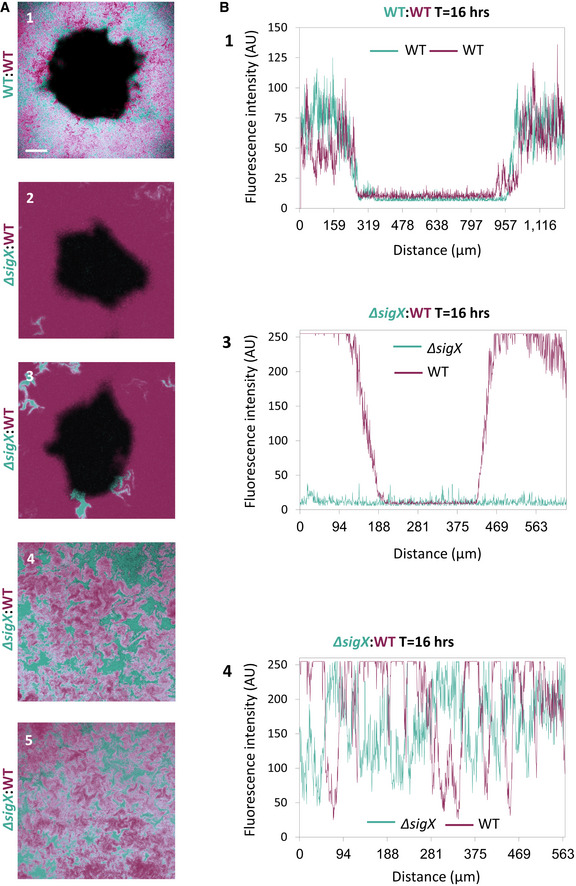
Figure EV2. ∆sigX cells are excluded from the plaque rim during constriction.

- BDR2637 (Pveg ‐mCherry) (WT) (purple) cells were mixed with AR16 (PrrnE ‐gfp) (WT) (cyan) (1) or with ET191 (∆sigX, PrrnE ‐gfp) (cyan) (2‐5) cells. The mixtures were infected with low concentrations (10‐8 PFU/ml) of SPP1, placed on an agarose pad, and plaque formation was followed by time‐lapse confocal microscopy. Shown are overlay images of mCherry (purple) and GFP (cyan) signals captured 16 h postinfection. (1‐3) show plaque regions, whereas (4‐5) show regions remote from any visible plaque site. Scale bar, 100 µm.
- Quantification of images 1, 3, and 4 presented in EV2A. Fluorescence intensity (AU) of the plaques formed by phages infecting the corresponding cells is shown. Fluorescence from Z sections that include the plaque region and flanking area or control areas was measured.
Source data are available online for this figure.
