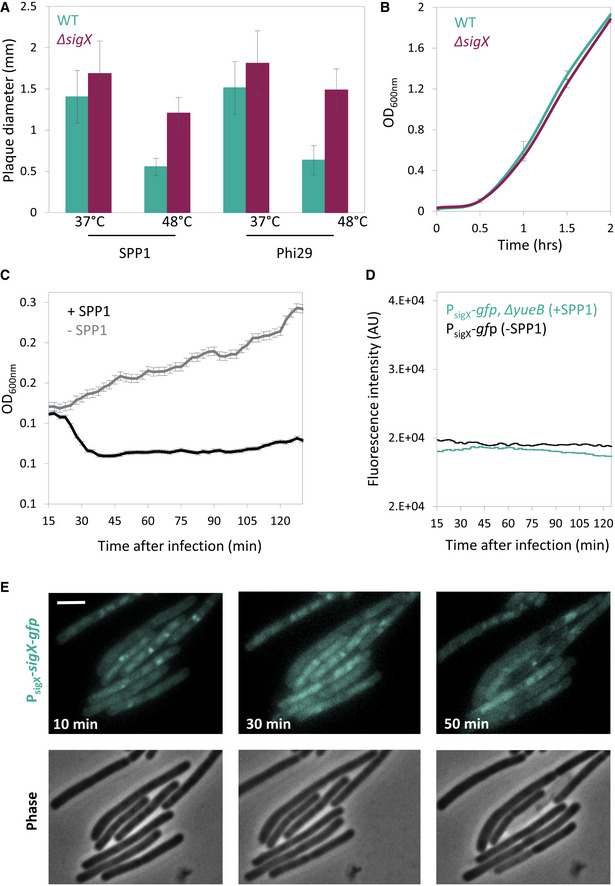
Figure EV3. Monitoring SigX activation during phage infection.

- PY79 (WT) and ET19 (∆sigX) cells were infected with SPP1 or Phi29 (10‐6 PFU/ml), spread over MB agar plates, and incubated at either 37°C or 48°C. Plaque diameter was monitored after 20 h of incubation (n ≥ 50). Shown are average values and SD of 3 independent repeats.
- PY79 (WT) and ET19 (∆sigX) were grown in liquid LB medium at 48°C and OD600nm monitored. Shown are average values and SD of 3 biological repeats.
- Corresponds to the experiment presented in Fig 3A. Phage‐sensitive PY79 (WT) cells were mixed with phage‐resistant BS12 (ΔyueB, PsigX‐gfp) cells and the mixture was infected with SPP1 at 2:1 (phages:bacteria) MOI, and OD600nm was followed at 2.5‐min intervals. Uninfected mixed population served as a control (‐SPP1). Shown is a representative experiment out of 3 biological repeats, and the average values and SD of n ≥ 3 technical repeats.
- BS12 (PsigX ‐gfp, ∆yueB) cells were infected with SPP1 at 2:1 (phages:bacteria) MOI, and fluorescence intensity from PsigX ‐gfp (AU) was followed at 2.5‐min intervals. Uninfected BS4 (PsigX ‐gfp) cells served as a control. Shown is a representative experiment out of 3 biological repeats, and the average values and SD of 3 technical repeats.
- ET26 (PsigX ‐sigX‐gfp) cells were infected with SPP1 at 5:1 (phages:bacteria) MOI, placed on an agarose pad, and followed by time‐lapse fluorescence microscopy. Shown are signal from SigX‐GFP (upper panels), and corresponding phase contrast images (lower panels), captured at the indicated time points postinfection. Scale bar, 1 µm.
Source data are available online for this figure.
