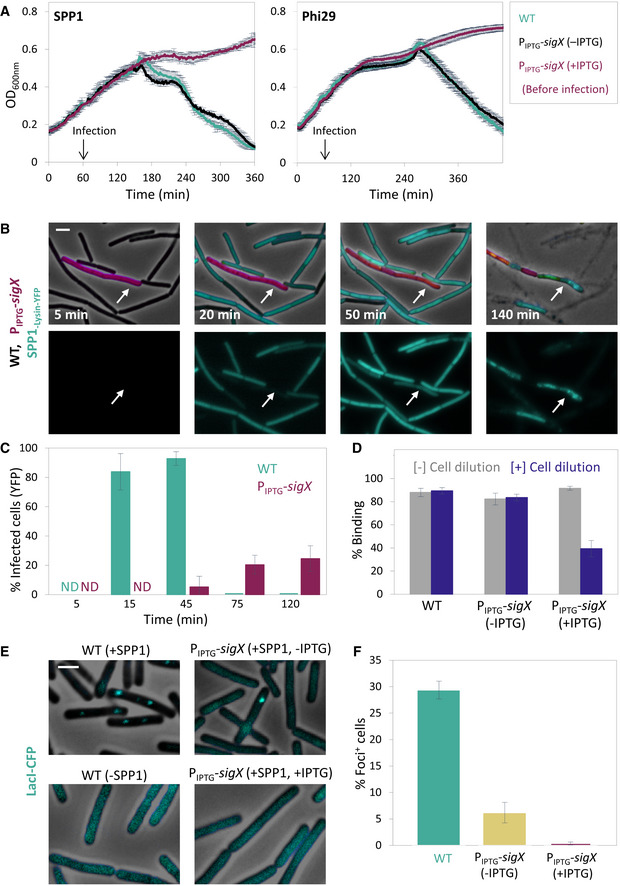
Figure 4. SigX expression confers phage tolerance.

- PY79 (WT) and ET28 (PIPTG ‐sigX) cells were infected with SPP1 or Phi29 (t = 60 min) at 1:20 (phages:bacteria) MOI, and OD600nm was followed at 2‐min intervals. IPTG was added 30 min before infection (t = 30 min). Shown is a representative experiment out of 3 biological repeats, and the average values and SD of 4 technical repeats.
- ET29 (Pveg ‐mCherry, PIPTG ‐sigX) (purple) cells were grown in the presence of IPTG and mixed with PY79 (WT) cells. The mixture was infected with SPP1‐lysin‐yfp 5:1 (phages:bacteria) MOI, placed on an IPTG‐containing agarose pad, and followed by time‐lapse fluorescence microscopy. Shown are overlay images of phase contrast (gray), signal from mCherry‐labeled cells (purple), and signal from Lysin‐SPP1‐YFP (cyan), captured at the indicated time points postinfection (upper panels). Corresponding signal from Lysin‐SPP1‐YFP (cyan) is shown separately (lower panels). Arrows highlight the delayed infection of ET29 cells. Scale bar, 1 μm.
- Quantification of the experiment described in (B). Shown is the percentage of phage infected PY79 (WT) and ET29 (Pveg ‐mCherry, PIPTG ‐sigX) cells at the indicated time points, scored by the Lysin‐SPP1‐YFP signal, with average values and SD (n ≥ 200 cells for each time point). Of note, the majority of WT cells were lysed at t = 75 min postinfection.
- PY79 (WT) and ET28 (PIPTG ‐sigX) cells, grown in the presence or absence of IPTG, were infected with SPP1 (1:1 MOI) for 10 min. Next, phage adsorption was monitored before and after cell dilution (×100 fold). Percentage of phage adsorption was calculated as follows: (P0−P1) × 100/P0, where P0 is the initial phage input in the lysate (PFU/ml), and P1 is the titer of free phages (PFU/ml) 10 min after infection. Shown are average values and SD of a representative experiment out of 3 independent experiments.
- OF83 (Ppen ‐lacIΔ11‐cfp) (WT) and ET40 (Ppen ‐lacIΔ11‐cfp, PIPTG ‐sigX) cells, grown in the presence or absence of IPTG, were infected with SPP1‐ delX110lacO64 at 5:1 (phages:bacteria) MOI. The formation of LacI‐CFP foci on phage DNA was monitored 10 min postinfection. Non‐infected OF83 cells were used for comparison. Shown are overlay images of phase contrast (gray) and signal from LacI‐CFP (cyan). Scale bar, 1 µm.
- Quantification of the experiment described in (E). Shown is the percentage of LacI‐CFP foci 10 min postinfection of OF83 and ET40 cells by SPP1, with average values and SD (n ≥ 850 cells for each population). This is a representative experiment out of 3 biological repeats.
Source data are available online for this figure.
