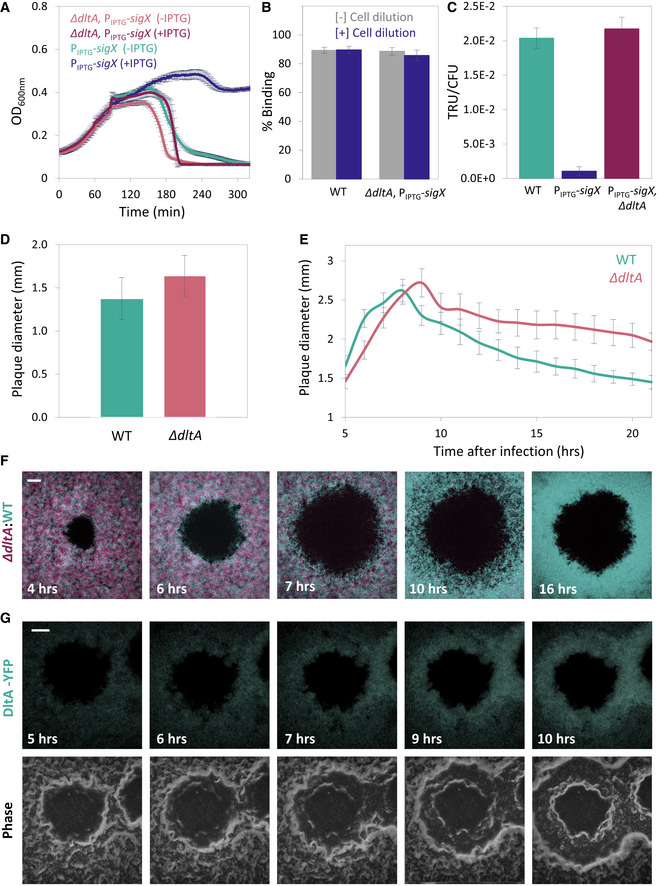
ET28 (PIPTG
‐sigX) and ET42 (∆dltA, PIPTG
‐sigX) cells, grown in the presence or absence of IPTG, were infected with SPP1 at 1:20 (phages:bacteria) MOI, and OD600nm was followed at 2‐min intervals. Shown is a representative experiment out of 6 biological repeats, with the average values and SD of 8 technical repeats.
PY79 (WT) and ET42 (ΔdltA, PIPTG
‐sigX) cells, grown in the presence of IPTG, were infected with SPP1 (1:1 MOI) for 10 min. Next, phage adsorption was monitored before and after cell dilution (×100‐fold). Percentage of phage adsorption was calculated as follows: (P0−P1) × 100/P0, where P0 is the initial phage input in the lysate (PFU/ml), and P1 is the titer of free phages (PFU/ml) 10 min after infection. Shown are average values and SD of 5 biological repeats.
PY79 (WT), ET28 (PIPTG
‐sigX), and ET42 (ΔdltA, PIPTG
‐sigX), grown in the presence of IPTG, were transduced with SPP1‐pBT163 lysate, and the number of transductants was monitored by plating the cells on selective plates. Transduction unit (TRU) was calculated as the number of transductant colonies /total colony‐forming unit (CFU). Shown are average values and SD of 3 biological repeats.
PY79 (WT) and ET41 (ΔdltA) cells were infected with SPP1 (10‐6 PFU/ml), spread over an MB agar plate, and plaque diameter was monitored after 20 h of incubation. Shown is plaque diameter distributions for each strain (n ≥ 40).
Plaque formation dynamic of SPP1 was monitored by automated scanning (Levin‐Reisman
et al,
2010) on a lawn of infected (10
‐6 PFU/ml) PY79 (WT) or ET41 (
ΔdltA) cells grown on an MB agar plate. Shown are average values and SD from kinetics random plaques for each strain (
n ≥ 10).
AR16 (PrrnE
‐gfp) (WT, cyan) and ET411 (Pveg
‐mCherry, ∆dltA) (∆dltA, purple) cells were mixed, infected with low concentrations (10‐8 PFU/ml) of SPP1, placed on an agarose pad, and plaque formation was followed by time‐lapse confocal microscopy. Shown are overlay images from GFP (cyan) and mCherry (purple) signals of the bacterial lawn captured at the indicated time points (h). The plaque is seen as a hole formed on the bacterial lawn. Scale bar, 150 µm.
ET43 (dltA‐yfp) cells were infected with low concentrations (10‐8 PFU/ml) of SPP1, placed on an agarose pad, and plaque formation was followed by time‐lapse confocal microscopy. Shown are fluoresce from DltA‐YFP signal (upper panels) and corresponding phase contrast images (lower panels), captured at the indicated time points (h). The plaque is seen as a hole formed on the bacterial lawn. Scale bar, 100 µm.

