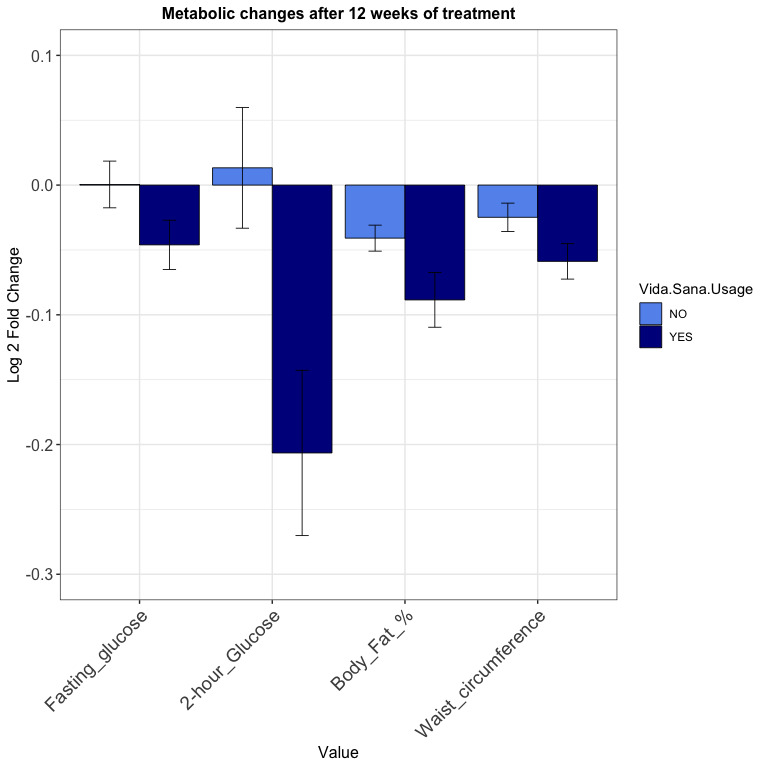
Figure 3.

Changes in metabolic parameters after 12 weeks of treatment according to platform usage. Log 2 fold changes are presented. P values were computed with a linear regression model using fold changes as outcomes, and age, sex, treatment, and education attainment as covariates. Vida Sana implementation after 3 months of intervention showed a significant decrease in fasting glucose (P=.03), 2-hour glucose (P=.04), body fat percentage (P=.024), and waist circumference (P=.023).
