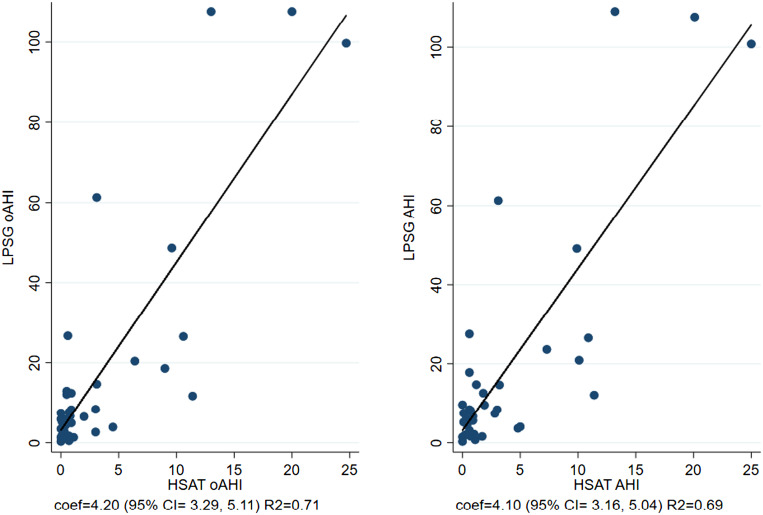
Figure 1. Scatterplots.
Left: Scatterplot of oAHI for both LPSG and HSAT (regression coefficient = 4.20; 95% CI, 3.29–5.11; R2 = 0.71). Right: Scatterplot of AHI for LPSG and HSAT (regression coefficient = 4.10; 95% CI, 3.16–5.04; R2 = 0.69). AHI = apnea-hypopnea index, CI = confidence interval, coef = coefficient, HSAT = home sleep apnea test, LPSG = laboratory polysomnography, oAHI = obstructive apnea-hypopnea index.

