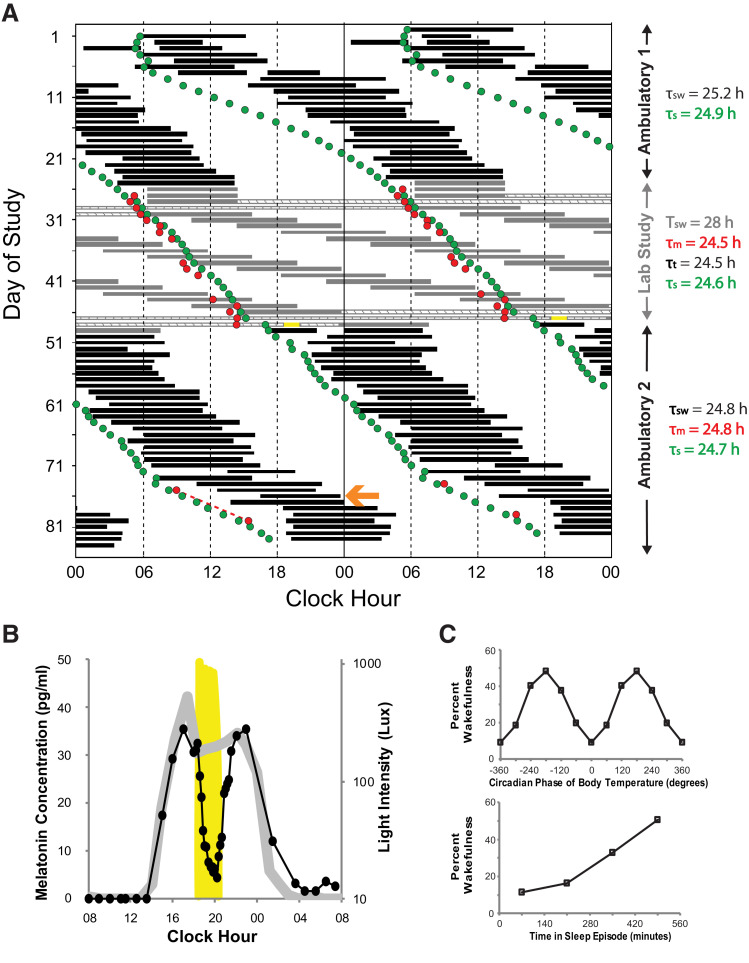
Figure 1. Participant 1.
(A) Double-raster plot of the experimental protocol. Hours are along the horizontal axis and days down the vertical axis; 2 days are plotted across each horizontal line. Sleep timing is represented by the black (self-selected) and gray (scheduled) bars. Hatched bars show the constant routines and yellow bar the timing of the bright light for the melatonin suppression test. Red circles indicate the timing of the dim light melatonin onsets and the green circles are the model simulated time of the onset of melatonin synthesis. The calculated period (denoted by the Greek letter τ) for each segment using different metrics is shown to the right using the same color as in the raster plot (sw: sleep-wake; s: simulation; m: melatonin; t: temperature). Note instances (eg, day 76, orange arrow) where sleep is initiated late relative to the DLMO and might therefore be expected to increase exposure to phase-delaying light and minimize exposure to phase-advancing light. (B) Results of the melatonin suppression test; melatonin levels on the night of the test are represented by the black closed circles and line while melatonin levels from 24-hours prior are represented by the gray line. Light levels are plotted on the secondary y-axis on a log scale; yellow shading plots the timing and intensity of the bright light. (C) Percent wakefulness during forced desynchrony as a function of circadian phase (0° defined as the core body temperature minimum) and time-into-sleep episodes.

