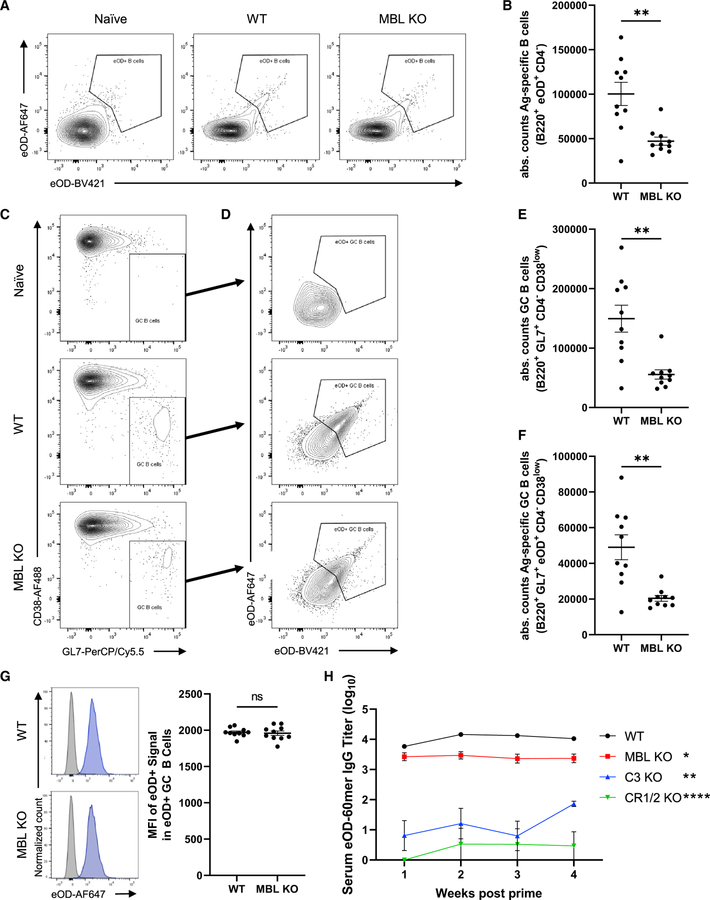
Figure 2. MBL KO mice have reduced germinal center and antibody responses to eOD-60mer immunization.
C57Bl/6 or MBL KO mice (n = 10/group) were immunized with 2 μg eOD-equivalent eOD-GT8 60mer and saponin adjuvant or PBS control.
(A–G) Flow cytometry analysis of GC B cell responses in draining inguinal lymph nodes 12 days post immunization. Shown are representative flow cytometry plots gating for antigen-specific B cells (A), absolute counts of B220+eOD+CD4− antigen-specific B cells (B), representative plots of GC B cells (C) and antigen-specific GC B cells (D), absolute counts of total B220+GL7+CD4−CD38low GC B cells (E), absolute counts of total B220+GL7+eOD+CD4−CD38low antigen-specific GC B cells (F), and representative histograms of eOD signal MFI among all cells (gray) and antigen-specific GC B cells (blue) and the antigen-specific GC B cell eOD signal MFI from each sample (G). Error bars indicate SEM; **, p <0.01; ns, not significant by Mann-Whitney test.
(H) Serum eOD-specific IgG titers over time in mice immunized with eOD-GT8 60mer. Error bars indicate SEM; *, p <0.05; **, p <0.01; ***, p <0.0001 relative to WT by one-way ANOVA followed by Tukey post hoc test.

