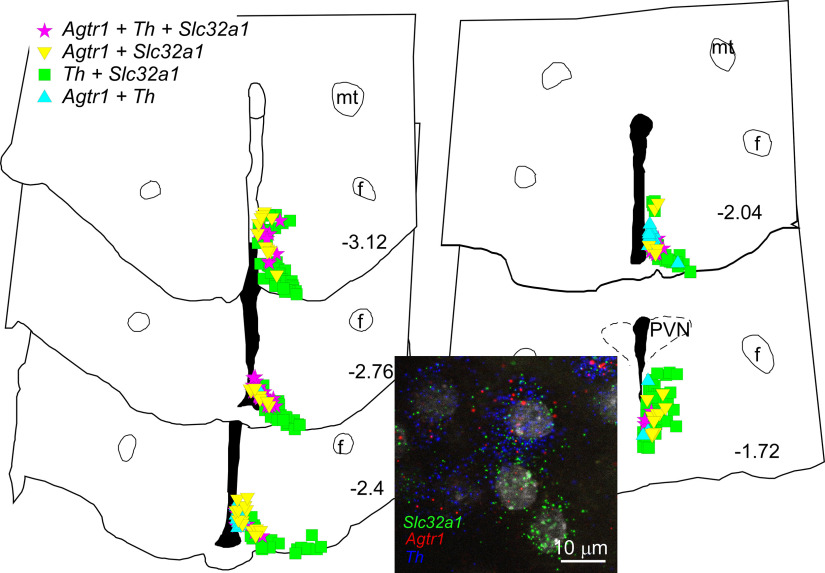
Figure 18.
AT1aR (Agtr1) are expressed in GABAergic (Slc32a1) TH (Th) neurons. Computer stage-assisted drawings of hypothalamic coronal sections through the ArcN showing the distribution of Agtr1 + Slc32a1+Th (magenta stars) amid Agtr1 + Slc32a1 (yellow inverted triangles), Agtr1 + Th (blue triangles) and Th + Slc32a1 neurons (green squares). Approximate millimeters behind bregma (after Paxinos and Watson, 2013) indicated by numbers in lower right of each section. Abbreviations as in Figures 16, 17. Inset, Photomicrograph of RNAscope assay for Agtr1, Slc32a1, and Th in ArcN. Agtr1 in red, Slc32a1 in green, and Th in blue. Scale bar: 10 μm.

