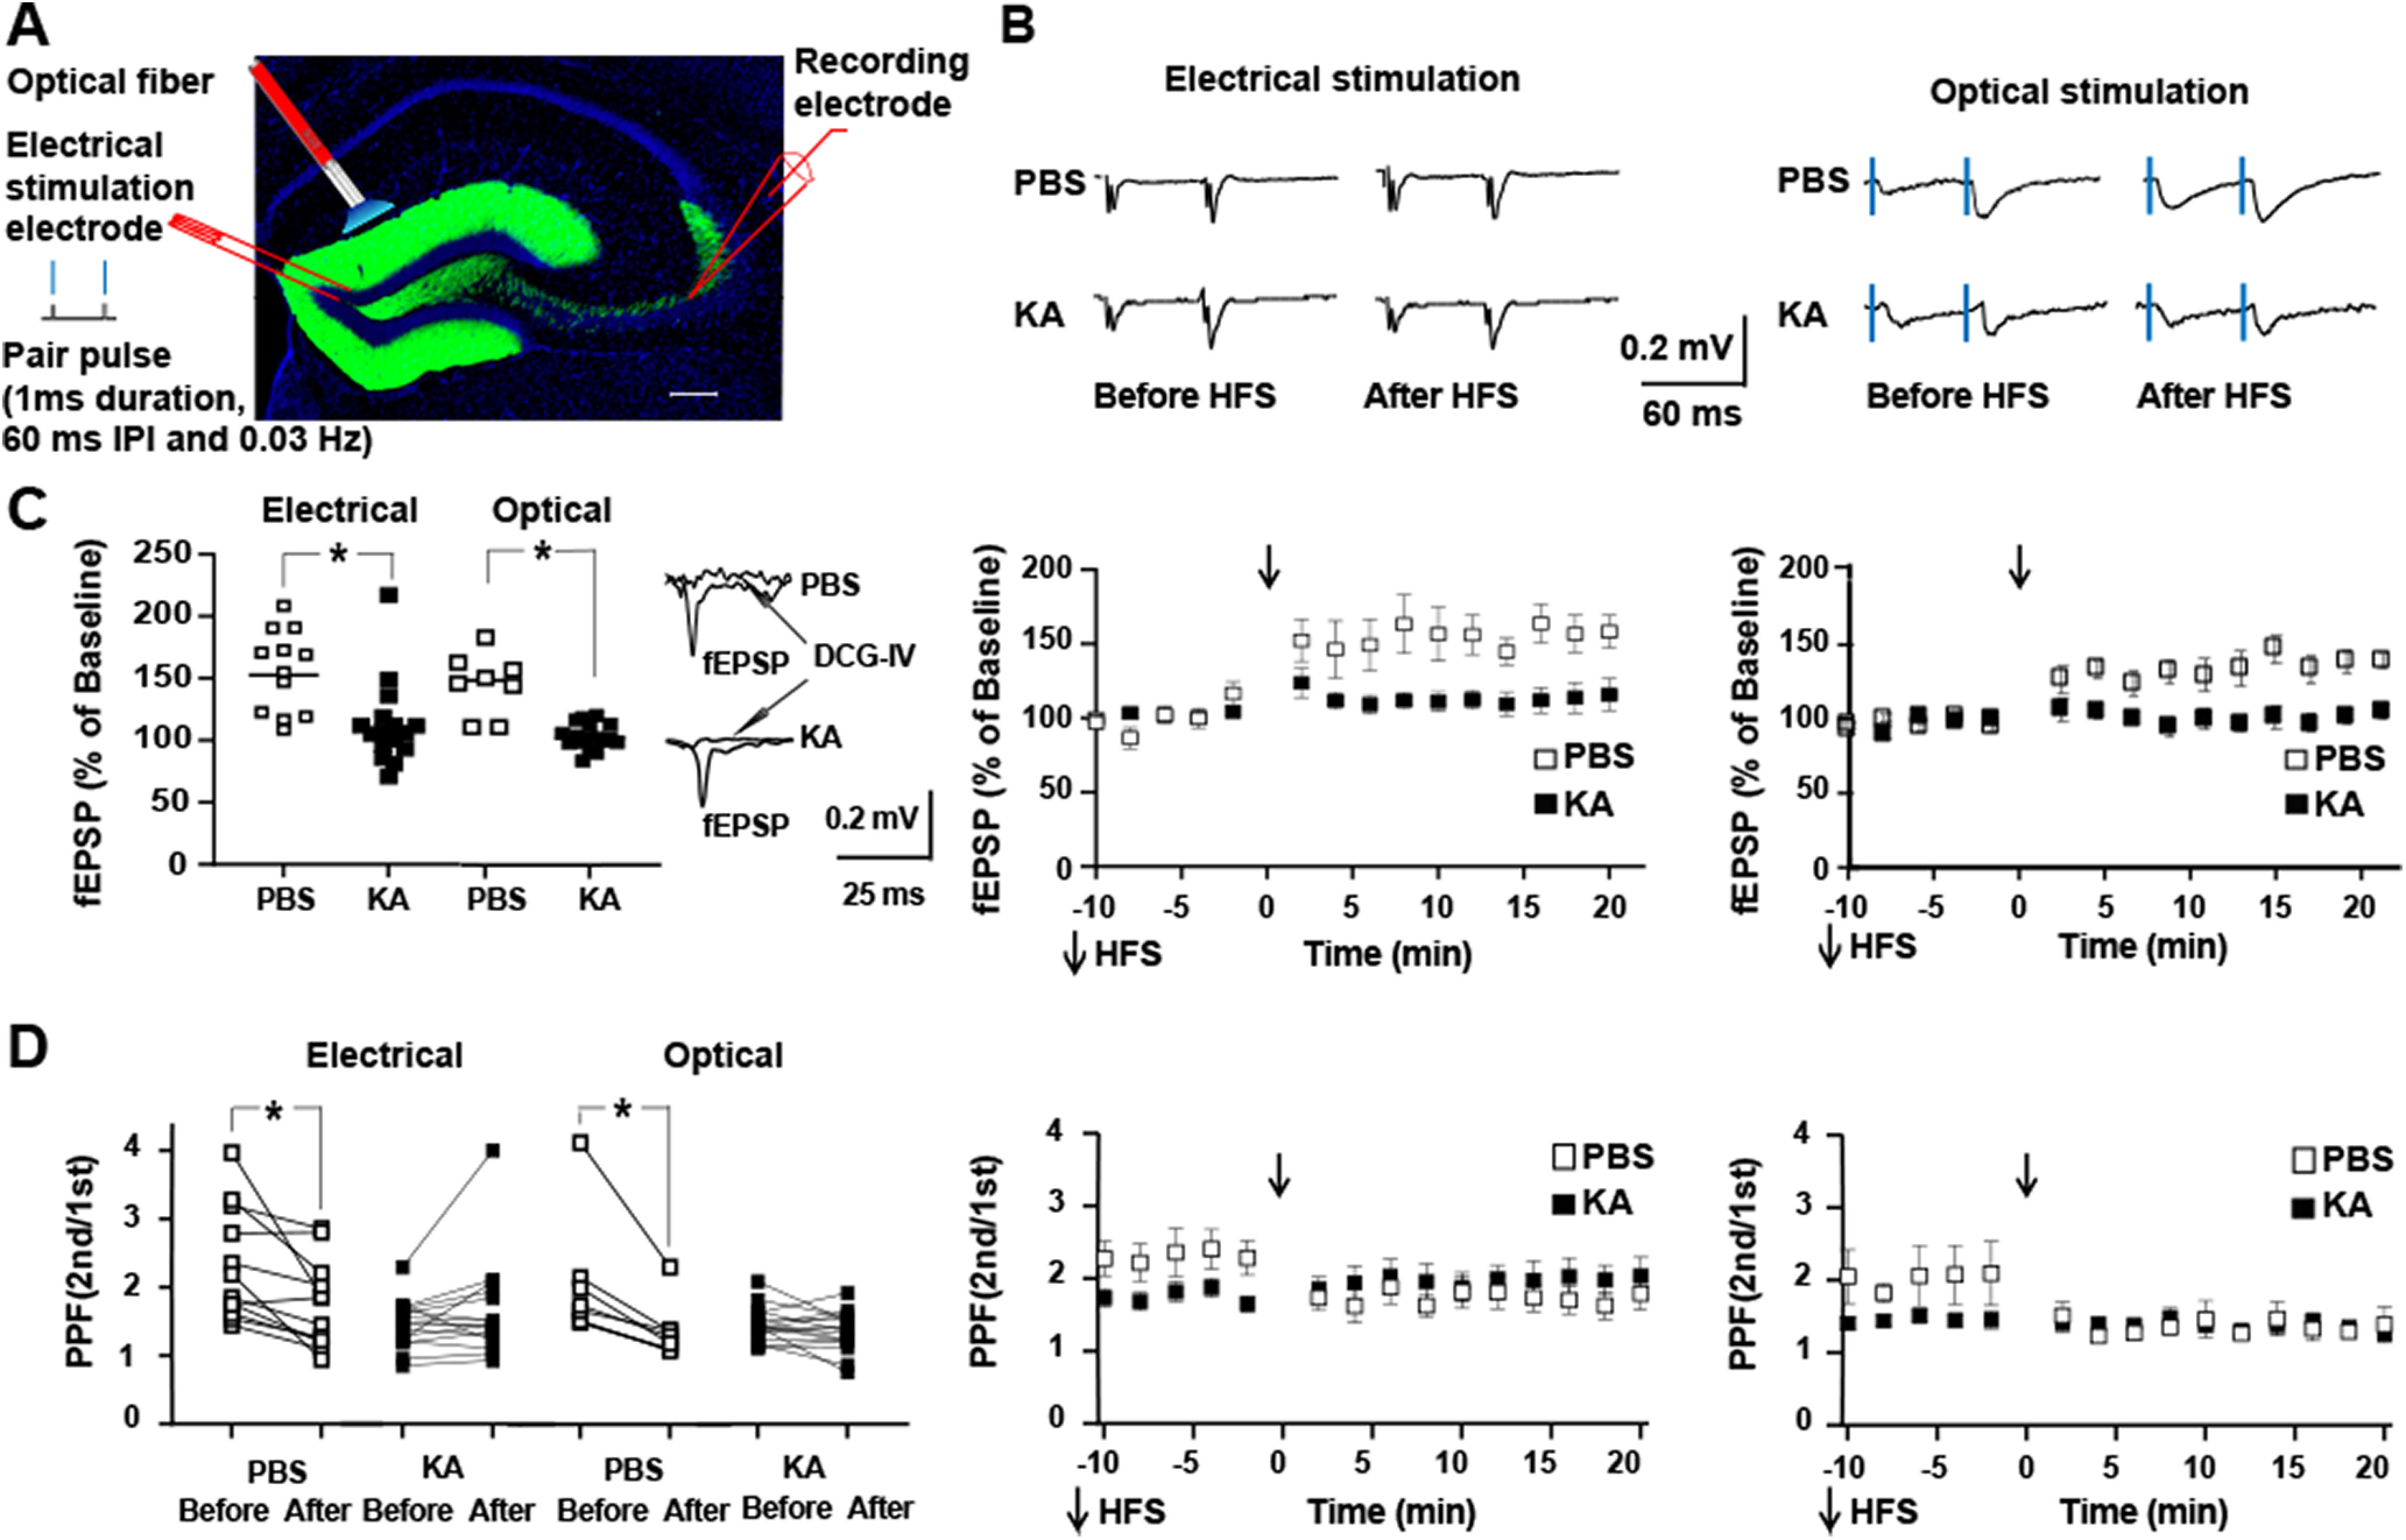
Figure 3.

Status epilepticus induces reduction of PPF and reduction of in vitro LTP of mossy fiber CA3 fEPSP. A, GFP fluorescence (green) in coronal section of dorsal hippocampus of DGC ChR mouse costained with DAPI reveals signal restricted to apical dendrites, cell bodies, and mossy fiber axons of dentate granule cells. Schematic depicts location of optical fiber and stimulating electrode. Stimuli administered in pairs (IPI denotes interpulse interval of 60 ms) at frequency of 0.03 Hz. B, Representative traces show EPSPs evoked by electrical (left) or optical (right) stimulation at time points collected 10 min before and between 10 and 20 min after application of HFS in slices isolated from mice infused with either PBS or KA. Artifact of electrical stimulus was subtracted from tracings. C, left panel, Repeated measures ANOVA with post hoc Bonferroni’s revealed that electrical stimulation induced LTP of mossy fiber evoked fEPSP in slices from PBS controls (156 ± 10%, n = 12, post hoc p = 0.001) but not in slices from KA-treated animals (113 ± 8%, n = 16, post hoc p = 0.4). Repeated measures ANOVA with post hoc Bonferroni’s revealed that optical stimulation induced LTP of mossy fiber evoked fEPSP in slices from PBS controls (141 ± 8%, n = 8, post hoc p =0.0002) but not in slices from KA-treated animals (100 ± 2.4%, n = 17, post hoc p = 0.5). Panels in middle and right present time course and mean ± SE of electrical and optimal stimulation, respectively. D, left panel, Repeated measures ANOVA with post hoc Bonferroni’s multiple comparisons revealed that electrical stimulation induced reduction of PPF in slices from PBS controls (before HFS 2.3 ± 0.25; after HFS 1.90 ± 0.27, p = 0.004) but not from KA-treated animals (before HFS 1.73 ± 0.10; after HFS 2.02 ± 0.22, p = 0.03). Likewise repeated measures ANOVA with post hoc Bonferroni’s multiple comparisons revealed that optical stimulation induced reduction of PPF in slices from PBS controls (before HFS 1.94 ± 0.23; after HFS 1.42 ± 0.14, p = 0.01) but not from KA-treated animals (before HFS 1.44 ± 0.06; after HFS 1.34 ± 0.07, p = 0.07). Central and right panels present time course and mean ± SE of electrical and optical stimulation, respectively. Post hoc Bonferroni’s multiple comparisons test revealed significant differences of PPF before HFS between PBS and KA undergoing either electrical (p = 0.02) or optical stimulation (p = 0.01).
