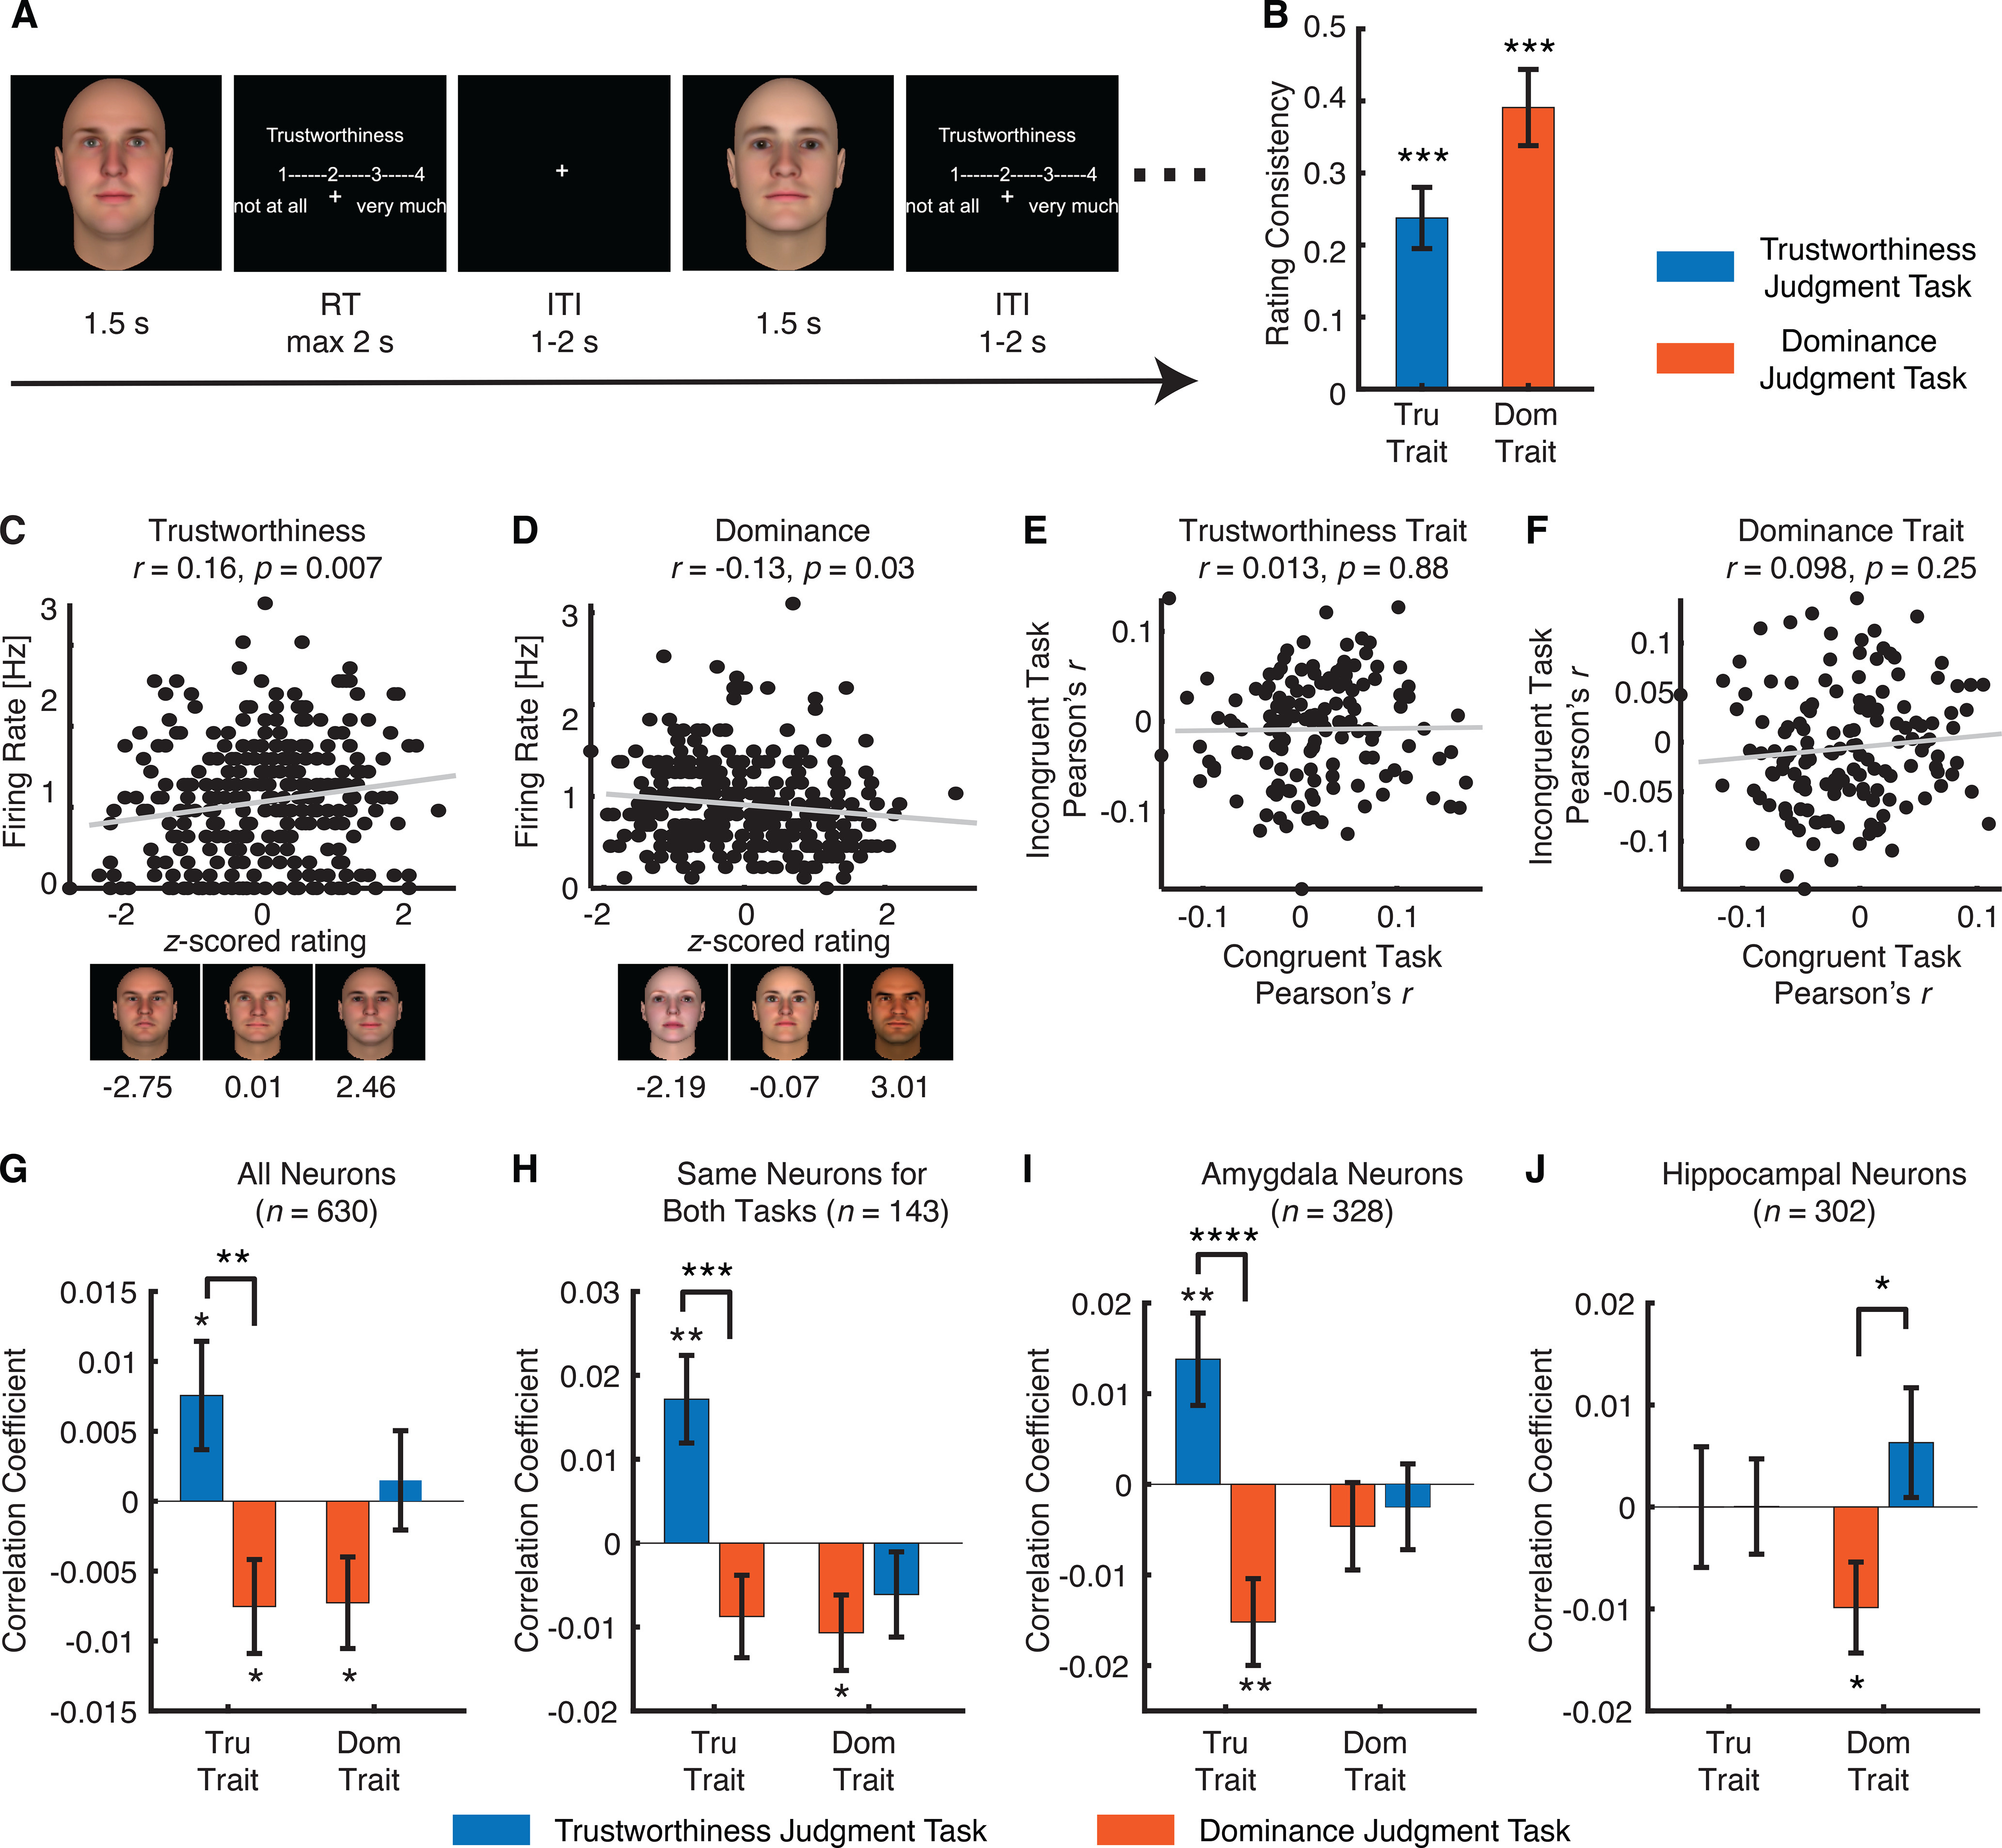
Figure 1.

Task modulation of neural encoding of social traits. A, Task. Each face was presented for 1.5 s, followed by participants’ judgment of trustworthiness/dominance within 2 s. The overall intertrial interval was jittered between 1 and 2 s. B, Correlation between the ratings from our neurosurgical patients with consensus ratings from Oosterhof and Todorov (2008). Tru: trustworthiness. Dom: dominance. Error bars denote 1 SEM across sessions. Asterisks indicate a significant difference from 0 using two-tailed paired t test; ***p < 0.001. C, D, Example neurons that showed a significant correlation between the normalized FR and the z-scored rating for (C) the trustworthiness trait and (D) the dominance trait. Each dot represents a face image, and the gray line denotes the linear fit. Sample face images with a range of consensus trustworthiness/dominance ratings are illustrated below the correlation plots, and the corresponding consensus ratings (z-scored) are shown under each sample face image. E, F, Scatterplot of correlation coefficient between congruent versus incongruent conditions. Each circle represents a neuron, and the gray line denotes the linear fit. E, Trustworthiness trait. F, Dominance trait. G–J, Correlation between neural response and social judgment ratings. Bars show the mean correlation coefficient under each task instruction. Error bars denote ±SEM across neurons. Asterisks indicate a significant difference from 0 (two-tailed paired t test) or between conditions (two-tailed two-sample t test); *p < 0.05, **p < 0.01, ****p < 0.0001. For each trait (trustworthiness or dominance), the left bars show the congruent conditions (i.e., the evaluated traits were the same as the task instruction) and the right bars show the incongruent conditions (i.e., the evaluated traits were different to the task instruction). G, All neurons (n = 630). H, The same neurons that were recorded in both trustworthiness and dominance judgment tasks (n = 143). I, Amygdala neurons only (n = 328). J, Hippocampal neurons only (n = 302). Extended Data Figure 1-1 shows assessment of spike sorting and recording quality. Extended Data Figure 1-2 shows control analyses for choices.
