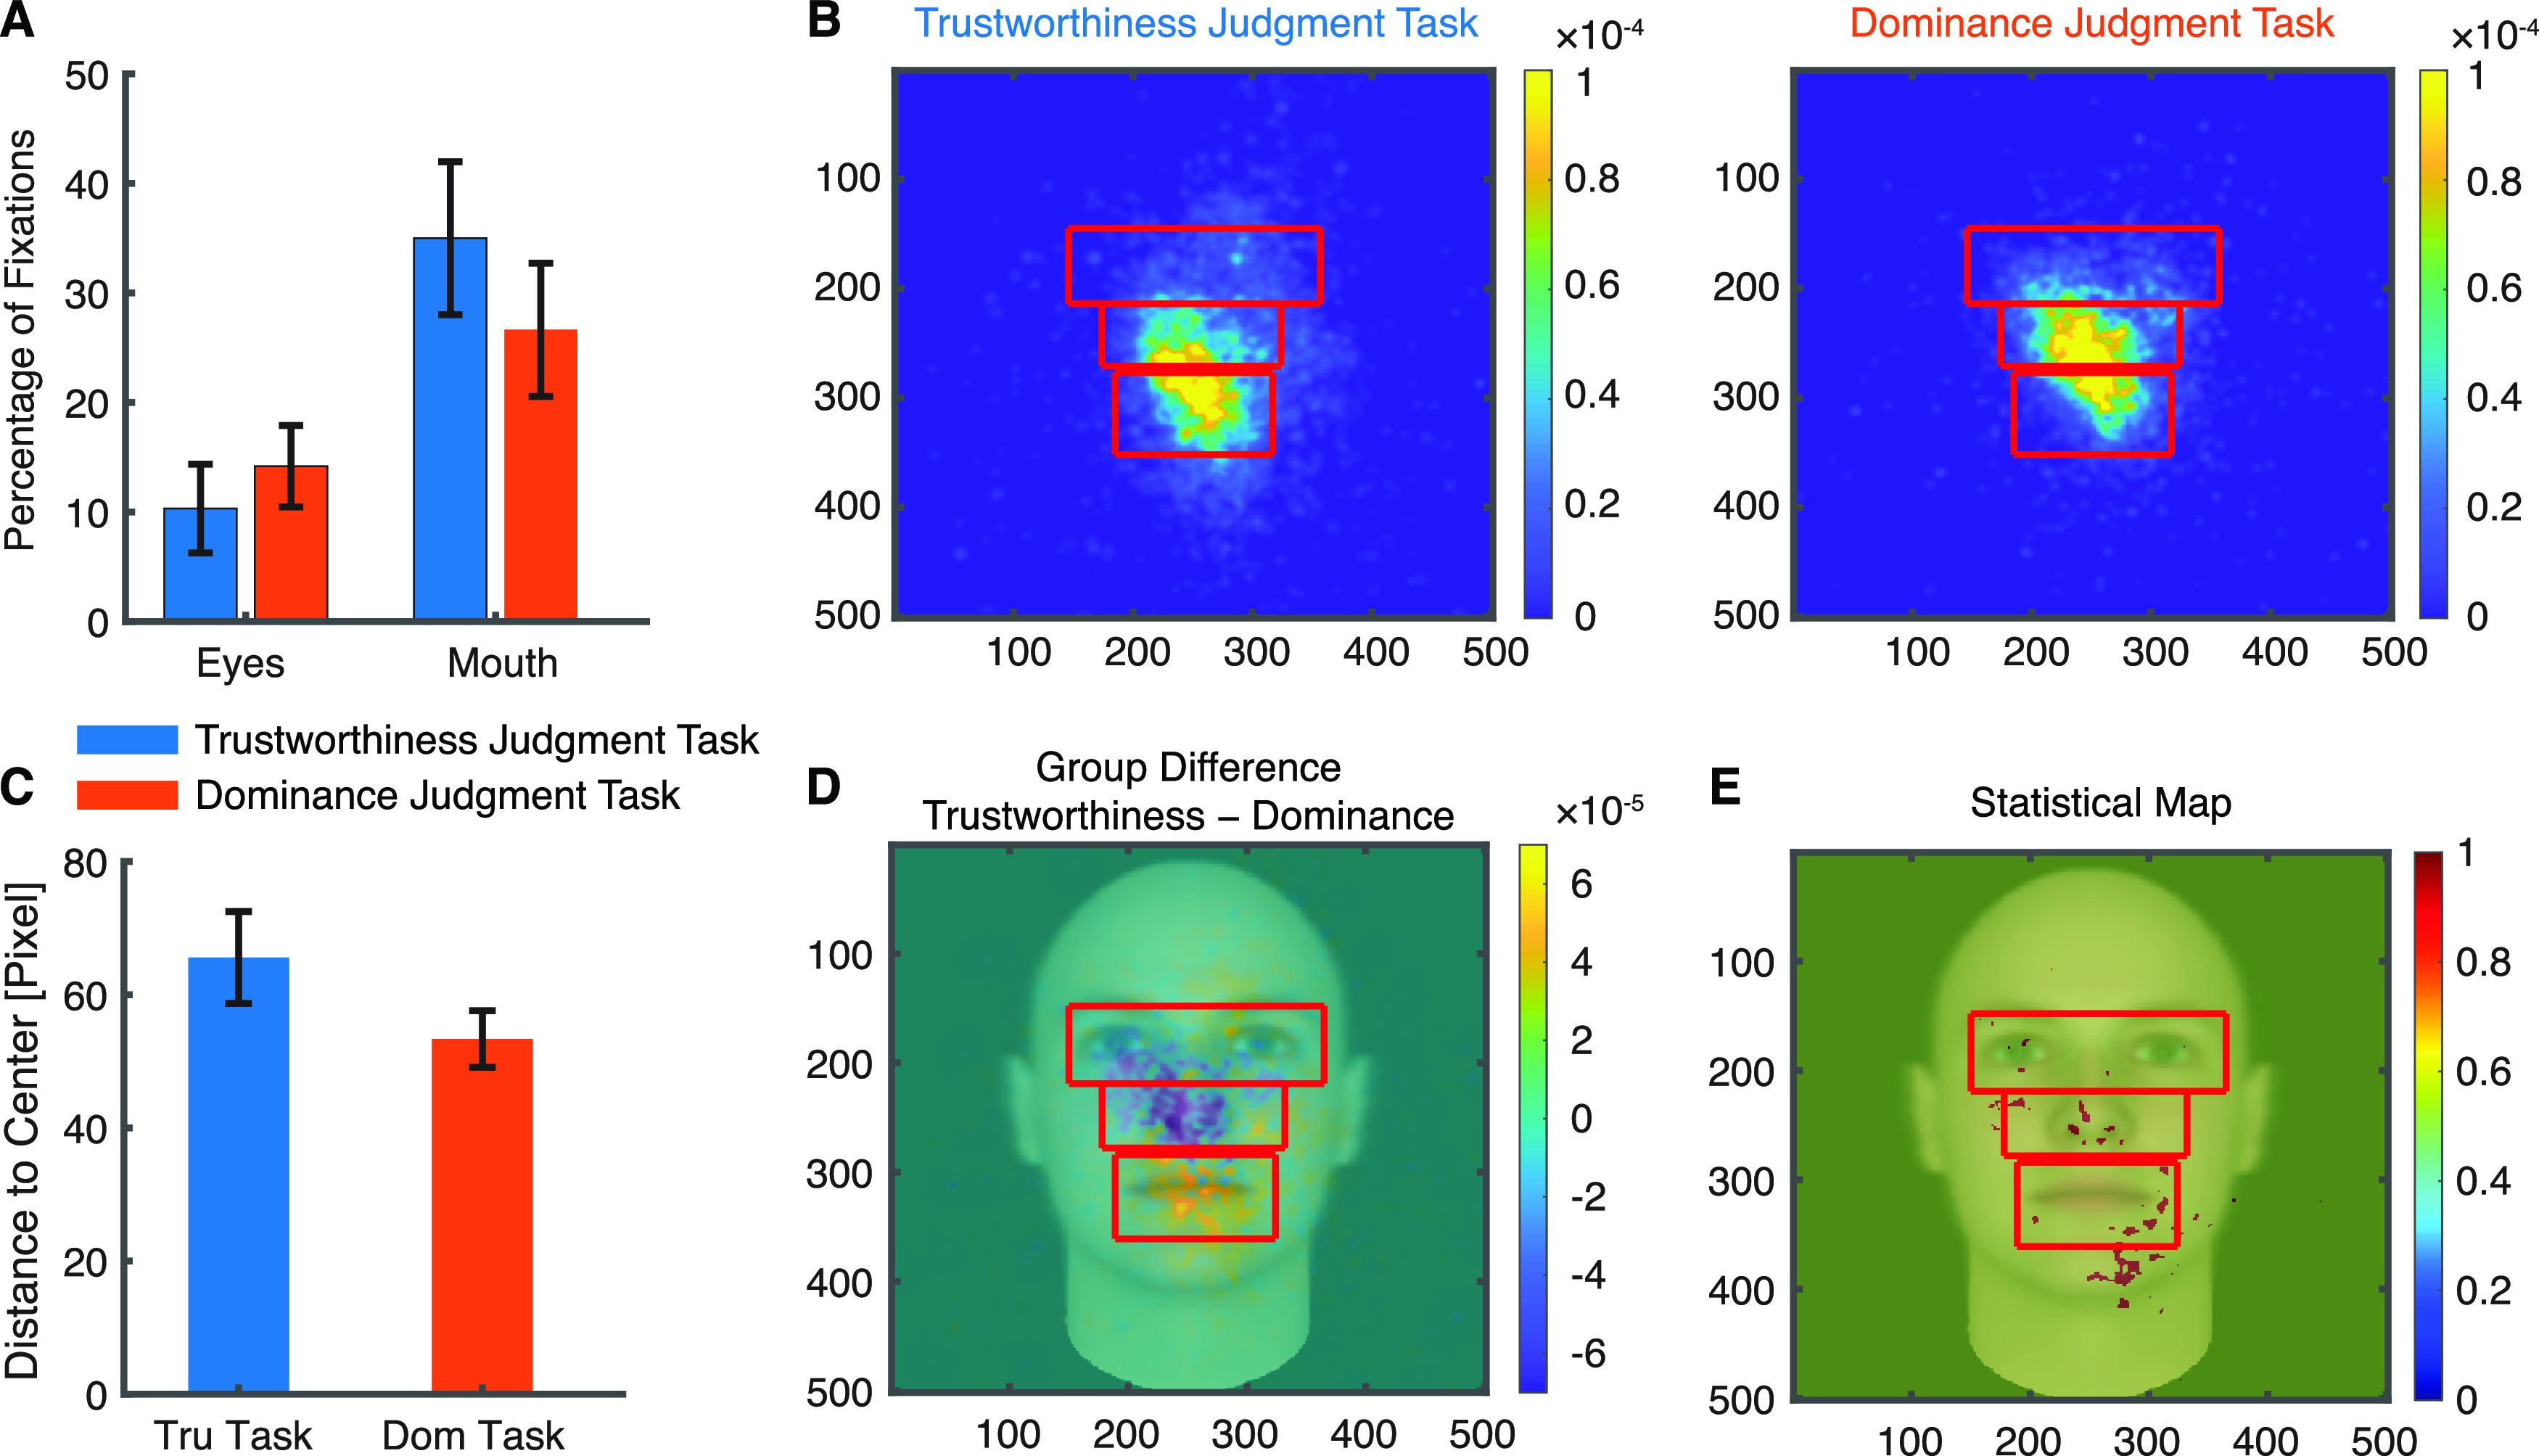
Figure 4.

Task modulation of eye movement onto faces. A, Percentage of fixations for each ROI. Error bars denote ±SEM across sessions. B, Fixation density maps to quantify eye movements for different tasks. Each map shows the probability of fixating a given location within the entire stimulus period. The scale bar (color bar) is in arbitrary units. The ROIs (eye, mouth, nose) used for analysis are shown in red (not shown to patients). C, Mean distance to the stimulus center (in pixels). Tru: trustworthiness. Dom: dominance. D, Group difference density map (trustworthiness − dominance) shows areas that patients fixated more in the trustworthiness judgment task (yellow), and vice versa (blue), with green meaning there was no difference between tasks. E, Statistical map shows areas that had a significant difference in density maps between tasks (red; two-tailed two-sample t test between individual density maps at each pixel, p < 0.05 uncorrected).
