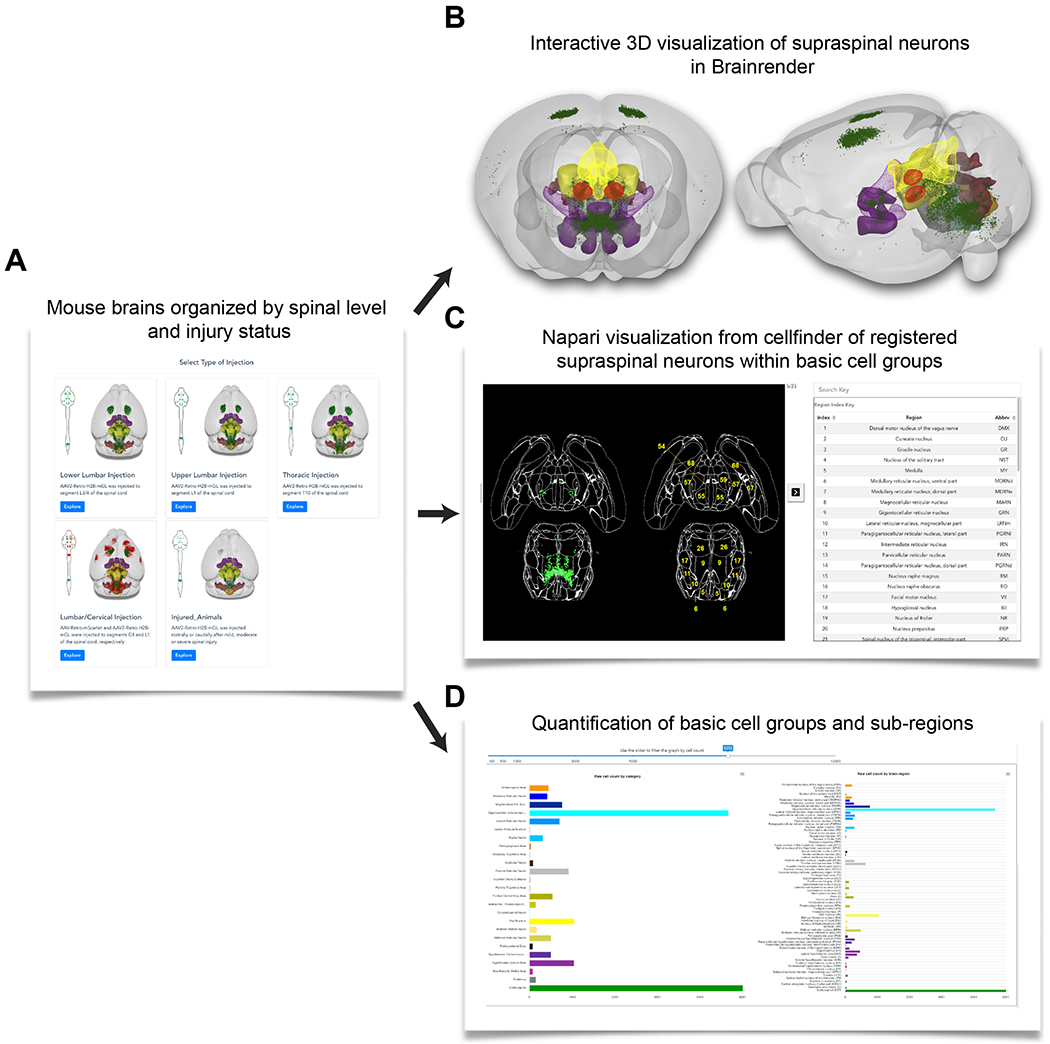
Figure 3. Overview of 3Dmousebrain.com, and online resource to visualize supraspinal neurons in intact and injured moue brains.

(A) An initial menu of sample types, organized by the spinal level of retrograde injection and injury status. Each type contains two or more example animals with associated data. (B) For each sample users can manipulate (zoom and rotate) a 3D representation of supraspinal neurons (green dots) overlaid on a standard atlas. (C) 2D representation of supraspinal neurons in which individuals cells are registered to defined brain regions in horizontal brain sections. (D) Graphs provide the number of supraspinal neurons that were identified in each of 69 brain regions (right), or in 25 summary regions that combine adjacent areas. The 3D representation was created by Brainrender, and the 2D and quantitative data were generated using cellfinder; both are open source tools created by the Brainglobe initiative.
