
FIGURE 5.
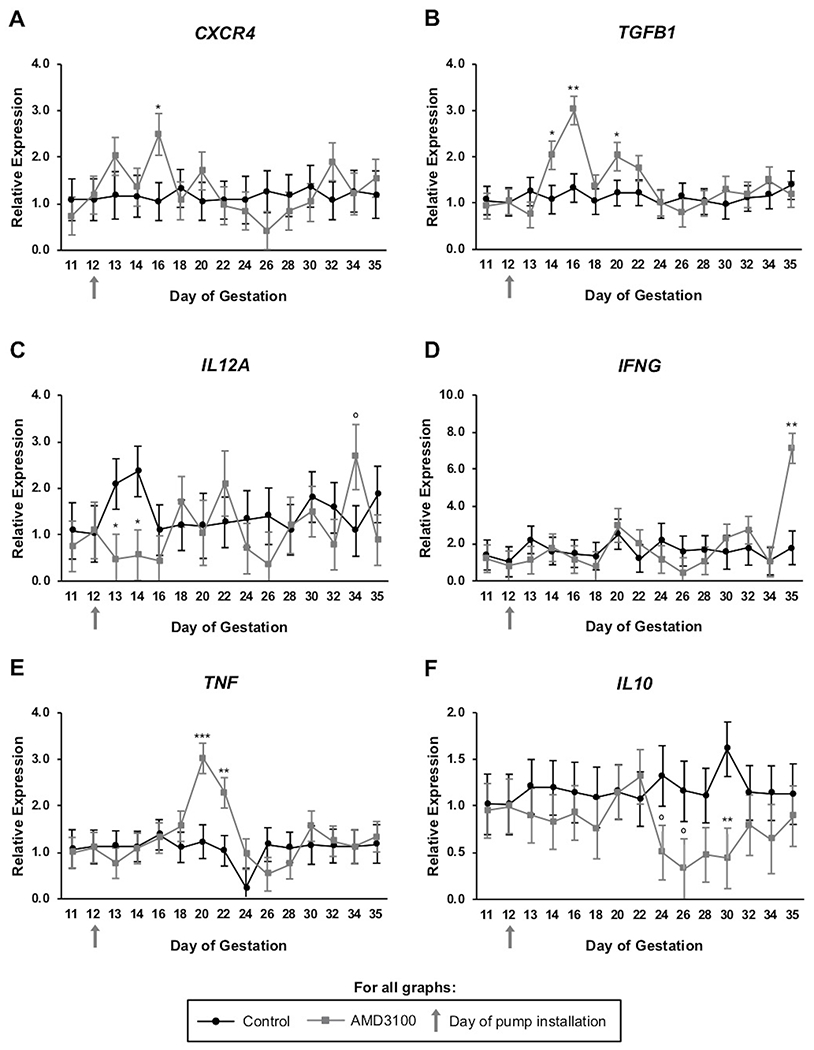
Inflammatory potential of circulating immune cells in pregnant ewes following AMD3100 infusion at the fetal-maternal interface. Graphs for CXCR4 (A), TGFB1 (B), IL12A (C), IFNG (D), TNF (E), and IL10 (F) all represent expression across days 11 through 35 of gestation. mRNA data are represented by graphing 2−ΔΔCq and graphs represent means for each day. Significance determined at P < 0.05 (*), P < 0.01 (**), P < 0.001 (***), and tendency accepted at P < 0.1 (°).