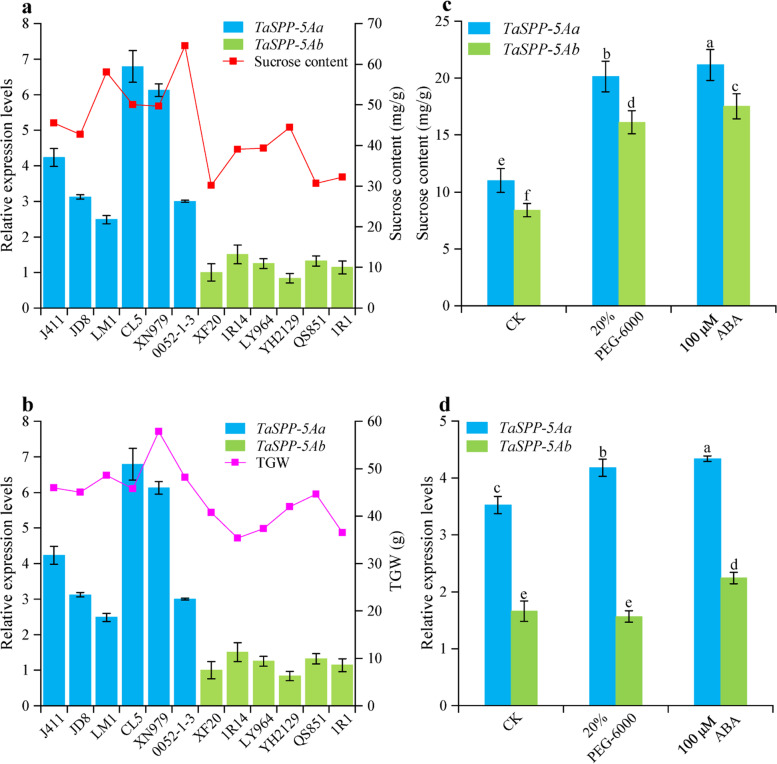
Fig. 3.
The relative expression levels of TaSPP-5A in common wheat varieties carrying TaSPP-5Aa or TaSPP-5Ab haplotypes were analyzed by qRT-PCR. (a, b) Relationship between sucrose content (a) and TGW (b) with TaSPP-5A expression in two TaSPP-5A haplotypes. The error bars represent SD from three biological replicates. Each replicate means the data got from a variety plant. XF20 was used as the reference sample. J411: Jing411; JD8: Jingdong8; LM1: Lumai1; CL5: Changle5; XN979: Xinong979; XF20: Xifeng20; LY964: Longyuan964; YH2129: Yunhan2129; QS851: Qingshan851. (c, d) Sucrose content (c) and expression level (d) in two haplotypes at seedling stage under the treatment of 20% PEG-6000 and 100 μM ABA. The error bars represent SD from three biological replicates. Each replicate means the data got from a mixed pool which contained nine different variety plants. The ACTIN gene was used as an endogenous control in a, b, and d

