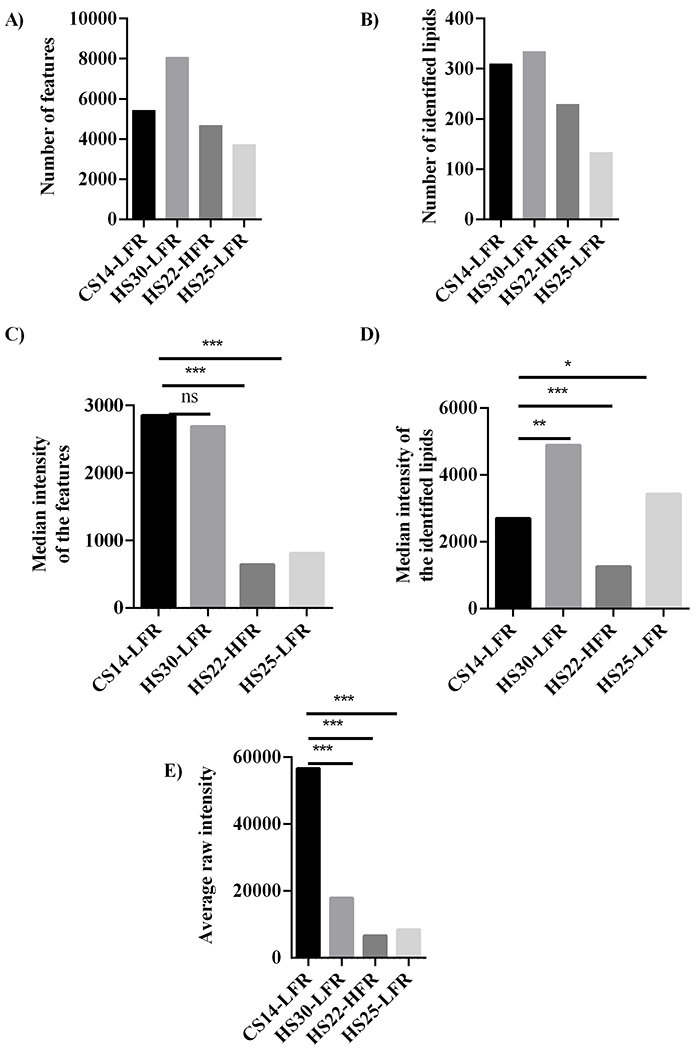
Figure 6.

Bar plots summarizing the (A) total number of features from both the positive and negative ionization mode, (B) the total number of identified lipids from both the positive and negative ionization mode, (C) the median intensity of all spectral features, (D) median intensity of spectral features only for the identified lipids, and (E) the average value of the raw intensities of all features for methods CS14-LFR, HS30-LFR, HS22-HFR, and HS25-LFR. Statistical significance is indicated as: no statistical difference, NS, p < 0.05, *, p < 0.01, **, and p < 0.001, ***.
