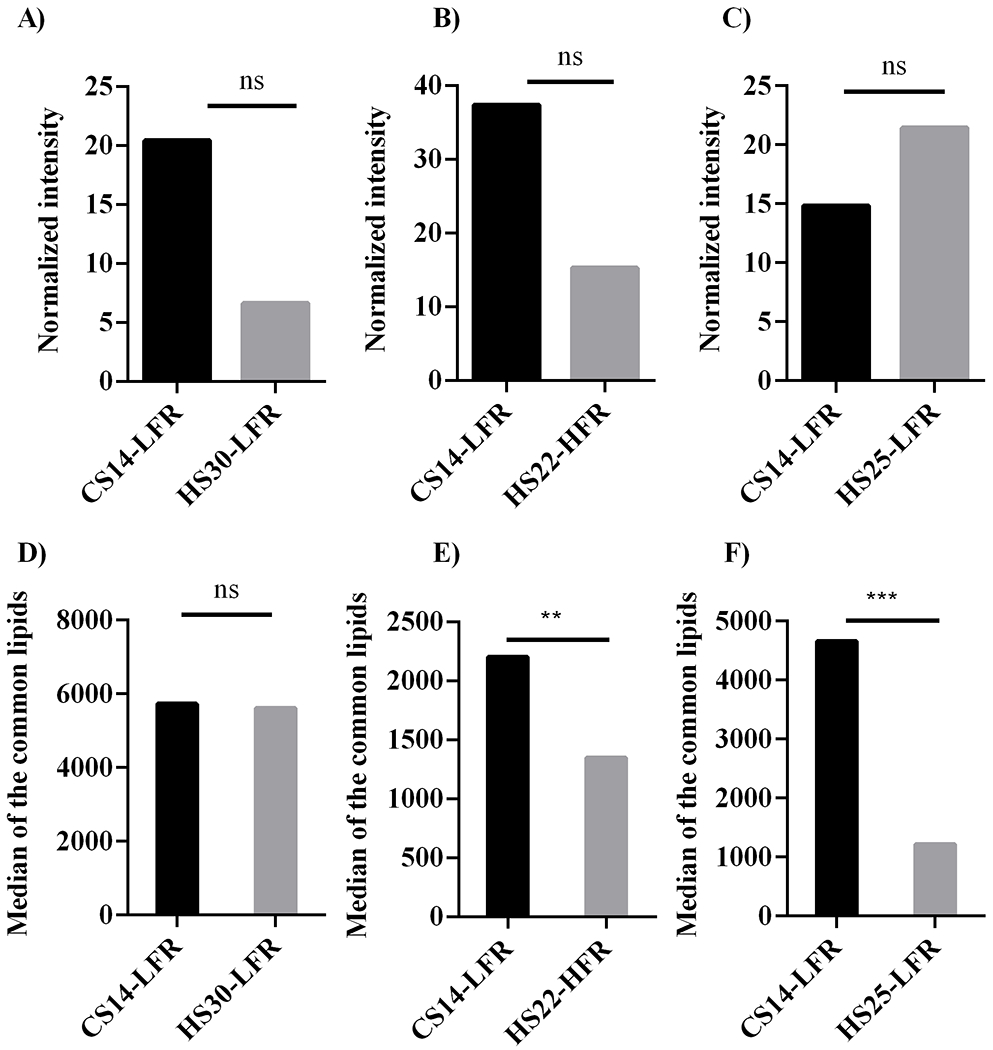
Figure 7.

Bar plots comparing the normalized lipid peak intensities from CS14-LFR to (A) HS30-LFR, (B) HS22-HFR, and (C) HS25-LFR. Bar plots comparing the median lipid peak intensities from CS14-LFR to (D) HS30-LFR, (E) HS22-HFR, and (F) HS25-LFR. Statistical significance is indicated as: no statistical difference, NS, p < 0.05, *, p < 0.01, **, and p < 0.001, ***.
