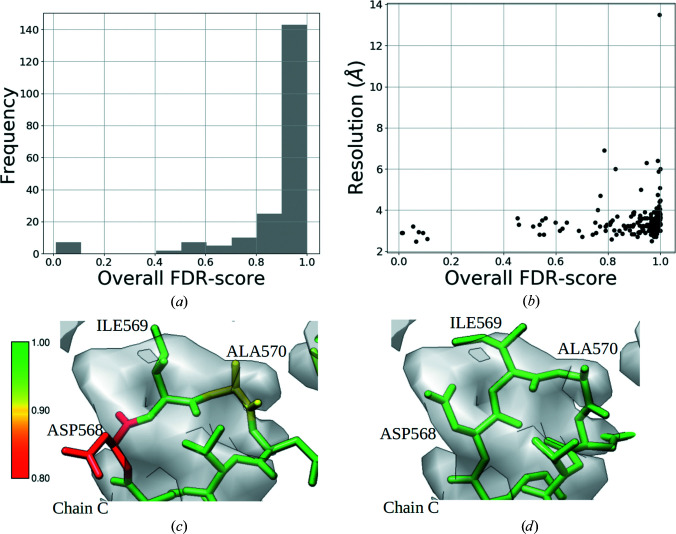
Figure 4.
(a) Histogram of the overall FDR-backbone metric from the SARS-CoV-2 data set. (b) Plot of the overall FDR-backbone metric versus resolution. (c) A region of the deposited model (residues 568–571, PDB entry 7c21) colored by the per-residue FDR-backbone scores. (d) The re-refined model colored by the per-residue FDR-backbone scores.

